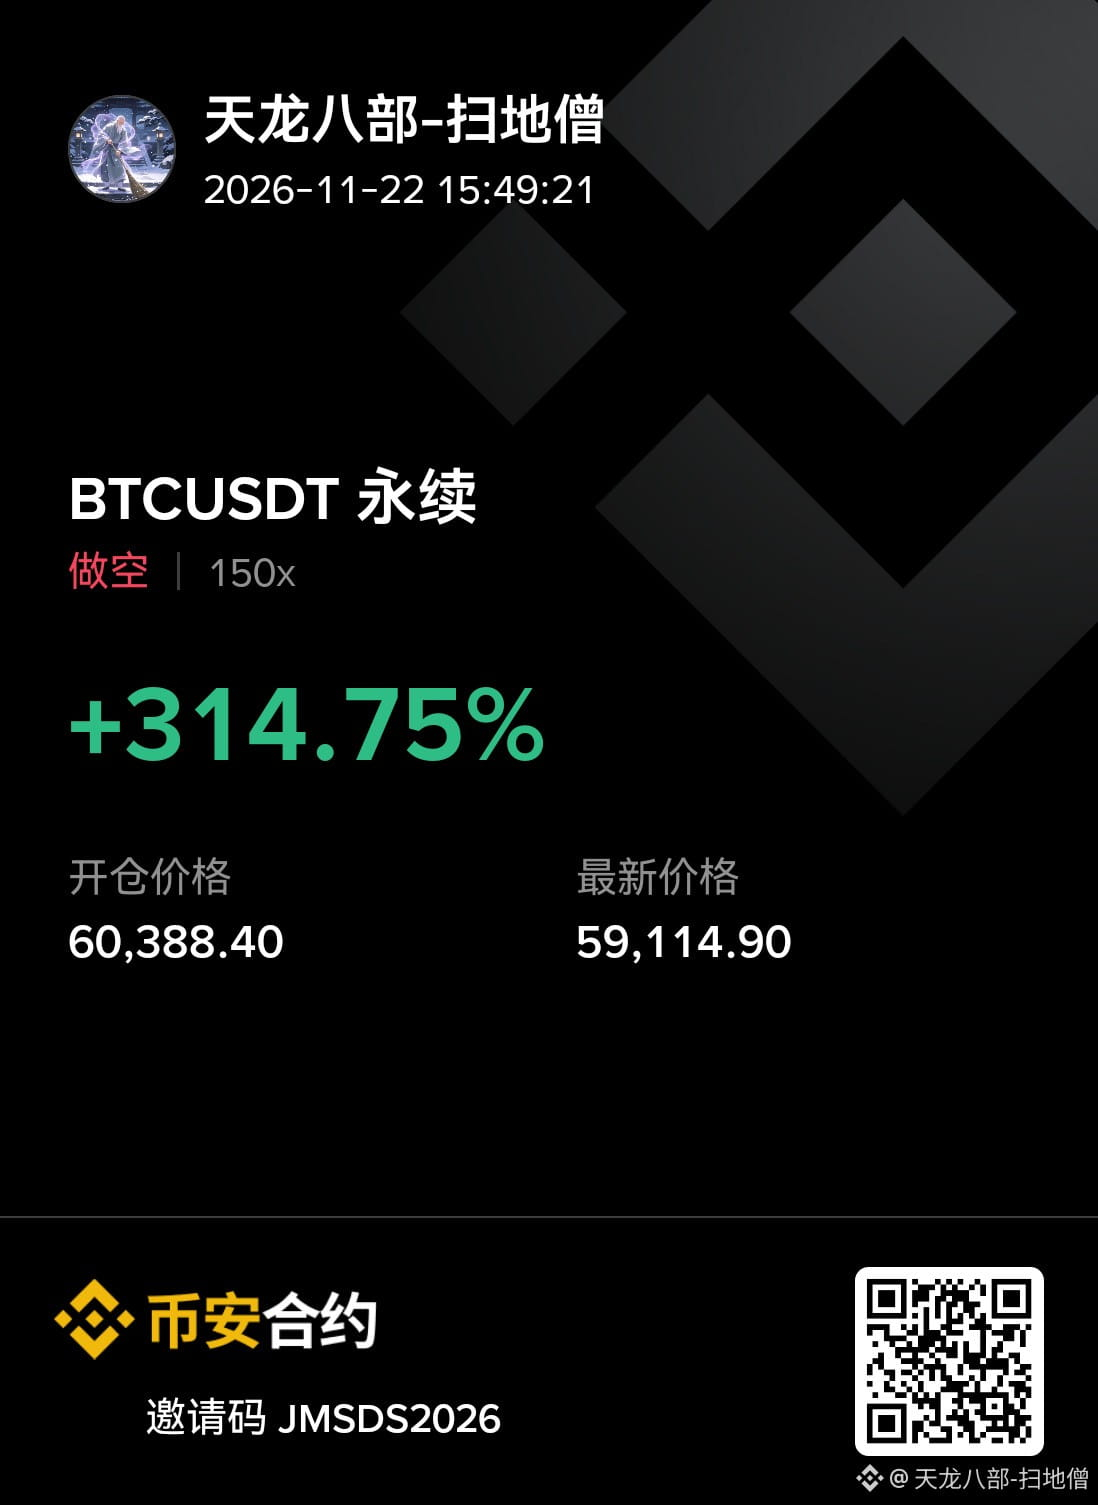
$BTC Last night during the livestream, I said that 61,000 was strong resistance. The market made a deep V-shaped move, but eventually retraced to around 61,000. This means the recent trend has continued to move sideways and downward. So last night, I recommended opening short positions at higher levels, with 61,000 as the stop-loss level.
Both 59,300 and 58,600 are support levels. Today, the market reached 58,700. It is currently moving sideways in the narrow 57,800–59,300 range. If this sideways movement causes short-term bullish indicators to become excessively overstretched, and the mid-term indicators continue to lag significantly, the market will fall further. If the short-term bullish indicators suddenly surge, then 58,600 is currently strong support—the bottom of this range. Whether you choose to take profit between 58,700 and 59,300 and wait on the sidelines before looking for another entry, or keep a breakeven stop in place and continue to hold your bearish view, I think either is fine.
My position on this trade is a bit large, so I’ll set a breakeven stop and continue to hold my bearish view!
Both 59,300 and 58,600 are support levels. Today, the market reached 58,700. It is currently moving sideways in the narrow 57,800–59,300 range. If this sideways movement causes short-term bullish indicators to become excessively overstretched, and the mid-term indicators continue to lag significantly, the market will fall further. If the short-term bullish indicators suddenly surge, then 58,600 is currently strong support—the bottom of this range. Whether you choose to take profit between 58,700 and 59,300 and wait on the sidelines before looking for another entry, or keep a breakeven stop in place and continue to hold your bearish view, I think either is fine.
My position on this trade is a bit large, so I’ll set a breakeven stop and continue to hold my bearish view!