

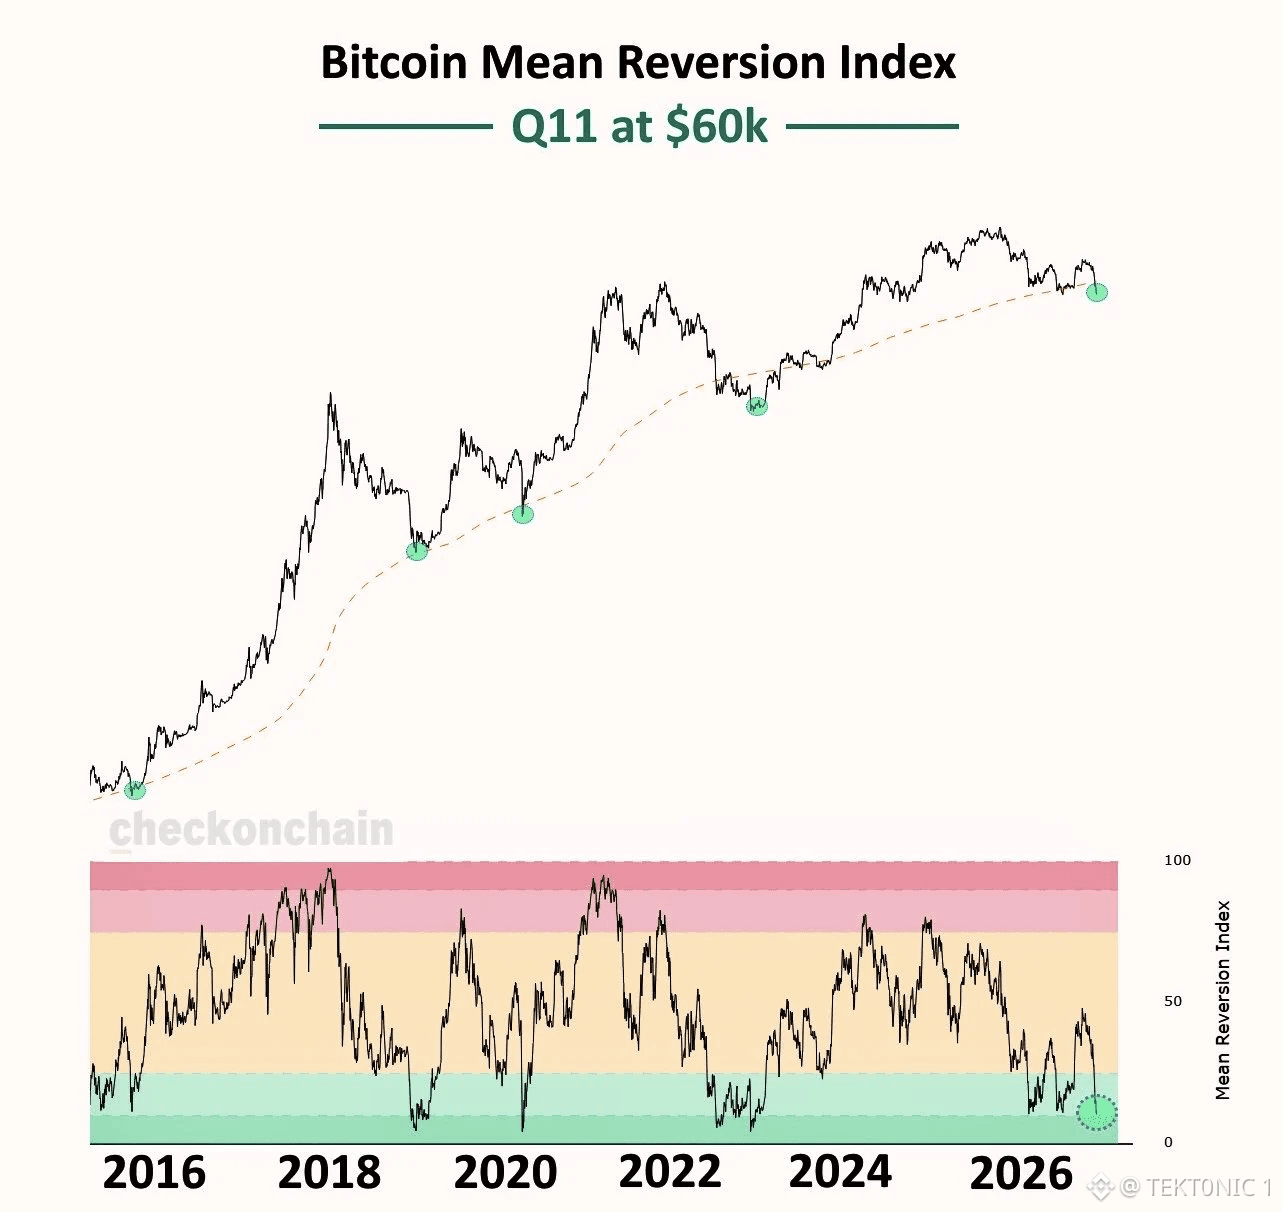
bitcoin's mean reversion index has fallen to Q11 at $60,000, placing btc in one of the most historically depressed valuation zones. the index compares bitcoin's price against multiple long-term valuation benchmarks, including moving averages, on-chain cost-basis models and other historical price anchors. rather than relying on one metric, it combines nine pricing models to measure how far $BTC has deviated from its historical reference values. a Q11 reading means bitcoin's current valuation sits near the bottom 11% of historical readings in this model's distribution. levels this low have historically been associated with deep bear-market valuation zones and periods of significant market stress. the chart shows previous periods where bitcoin returned toward its longer-term price anchors, including during the 2018, 2020 and 2022 bear-market lows. the current reading is approaching similar valuation territory. however, Q11 does not mean bitcoin has an 11% chance of falling further, or that a bottom is guaranteed. it represents a historical percentile, not a probability of future price movement. the significance is that $BTC is now trading at a level where its deviation from long-term valuation models has become historically uncommon. that makes this zone worth watching closely, even if further downside or prolonged consolidation remains possible. bitcoin is entering historically rare valuation territory. the signal is becoming stronger, but the market still has to confirm the bottom. #BTC Price Analysis# #Bitcoin Price Prediction: What is Bitcoins next move?# $XRP
Join global crypto users on Binance Square
⚡️ Get latest and useful information about crypto.
💬 Trusted by the world’s largest crypto exchange.
👍 Discover real insights from verified creators.
Email / Phone number