$POL: Testing the Leverage Signal
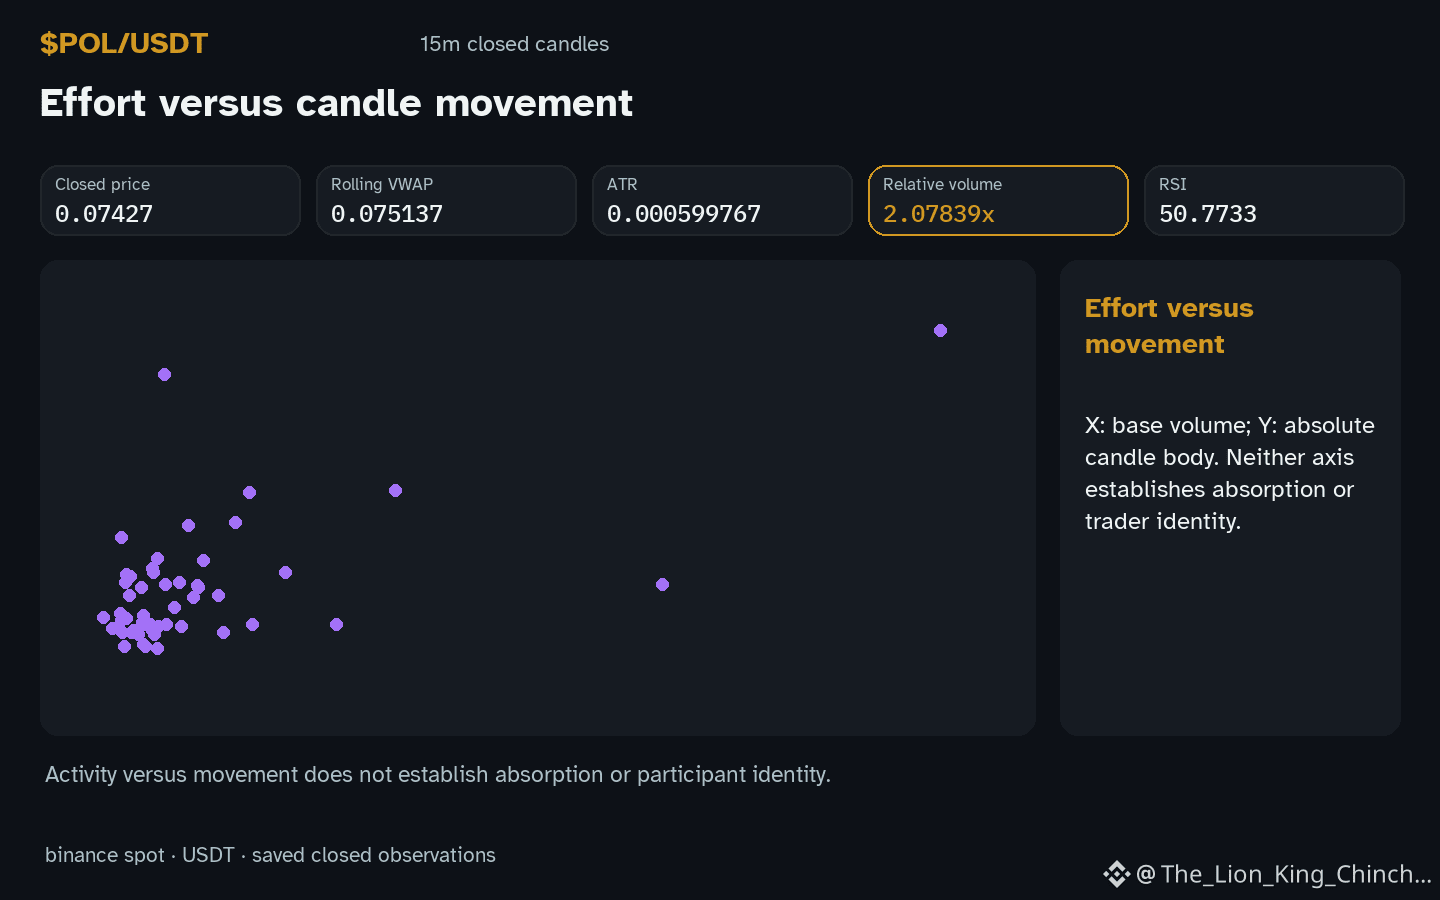
Does $POL move because of speculative positioning? The hourly direction is down while volume is above baseline. This creates a tension between price action and market activity. A common assumption is that high volume confirms trend strength. However, this reading has limits. Without funding rates or open interest data, we cannot prove the move is leverage-driven. The counterexample to consider is simple volume fluctuation. Traders might be rebalancing or closing positions naturally. This alternative reading weakens the leverage hypothesis because it requires no special positioning. What could change the reading is confirmation from missing derivatives metrics. If future data showed elevated short interest during the drop, the leverage story gains weight. Conversely, if the next closed candle shows volume returning to baseline while price stabilizes, the move may have been routine noise. Use RSI 50.8 as a context clue for momentum, not a cause. Relative volume 2.08x baseline indicates activity level, not direction or intent. The local range remains from 0.07168 to 0.07503. This analysis remains a theoretical framework. It does not assert actual trader motives or future price targets. The mechanism relies on conditional logic, not confirmed facts. The recorded observation describes only this specific moment. Future candles will provide the final evidence to support or reject this interpretation. Check how the next hourly bar closes relative to the current structure to refine the view.
Probabilistic market research, not a recommendation or guaranteed return.
#POL #MarketAnalysis #CryptoLearning
Does $POL move because of speculative positioning? The hourly direction is down while volume is above baseline. This creates a tension between price action and market activity. A common assumption is that high volume confirms trend strength. However, this reading has limits. Without funding rates or open interest data, we cannot prove the move is leverage-driven. The counterexample to consider is simple volume fluctuation. Traders might be rebalancing or closing positions naturally. This alternative reading weakens the leverage hypothesis because it requires no special positioning. What could change the reading is confirmation from missing derivatives metrics. If future data showed elevated short interest during the drop, the leverage story gains weight. Conversely, if the next closed candle shows volume returning to baseline while price stabilizes, the move may have been routine noise. Use RSI 50.8 as a context clue for momentum, not a cause. Relative volume 2.08x baseline indicates activity level, not direction or intent. The local range remains from 0.07168 to 0.07503. This analysis remains a theoretical framework. It does not assert actual trader motives or future price targets. The mechanism relies on conditional logic, not confirmed facts. The recorded observation describes only this specific moment. Future candles will provide the final evidence to support or reject this interpretation. Check how the next hourly bar closes relative to the current structure to refine the view.
Probabilistic market research, not a recommendation or guaranteed return.
#POL #MarketAnalysis #CryptoLearning