

I. Market action: This isn’t a pullback—it’s a series of defensive lines collapsing
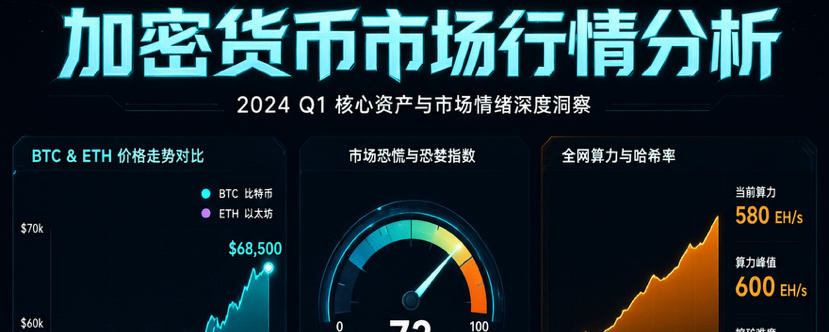
The data you have is already outdated. As of around midday on November 21, Bitcoin was fluctuating between $55,500 and $56,500, at one point down nearly 10% for the day and hitting a low of around $55,550. Ethereum also fell below $1,600, touching a low of $1,536, down more than 9% over 24 hours. This is no longer a matter of “hovering near this week’s low”—Bitcoin has hit a new low since September 2024, falling more than 50% from its October 2025 all-time high of $126,000. Its price is even below where it stood when Trump returned to the White House.
More importantly, consider the pace of the decline: the daily candle closed below $62,000 on November 19, closed below $60,000 for the first time on November 20, and plunged straight through $56,000 in the morning of November 21. The $60,000 line, repeatedly tested and defended over four months, was lost in just two days. The Fear and Greed Index is stuck at 11–12 in the “extreme fear” zone and has remained there for several consecutive days.
II. Causes of the decline: macro factors crushed valuations, structural factors weakened support, and events undermined confidence
The first layer is macroeconomic. Overnight, the Nasdaq plunged by around 1,200 points, Nvidia fell more than 14%, AI and chip stocks sold off across the board, and the U.S. stock market fear index surged. CoinShares’ head of research said bluntly that this latest crypto downturn was driven more by the sell-off in AI stocks than by problems within the industry. Notably, gold and silver fell at the same time, with spot gold dropping more than 2% to $3,534 per ounce. When even precious metals are falling, this is not “seeking safe havens”—it’s raising cash, a broad contraction in risk appetite. Bitcoin’s correlation with the S&P 500 and Nasdaq has actually risen in recent weeks. It is being traded as a risk asset right now, not a safe-haven asset.
The second layer is structural, and it is the most critical. U.S. spot Bitcoin ETFs recorded $582 million in net outflows on November 19 alone, including $541 million from BlackRock’s IBIT—the largest single-day outflow since the fund launched in January 2024. There were net outflows on 12 of November’s 14 trading days, totaling about $3.47 billion and wiping out all the net inflows accumulated this year. ETFs have been the biggest structural buyers in this rally; their disappearance is like pulling bricks, one by one, out of the floor. Meanwhile, Talos data shows that Bitcoin order-book depth within 1% of the spot price has fallen nearly 38% from its pre-Binance-hack peak. The depleted market depth means any large order can push prices even lower. Miners are selling too: MARA and Riot reported selling around 60,000 Bitcoin this month to fund their transition into AI and data center infrastructure.
The third layer is the aftermath of the incident. Although Binance announced at the end of October that it had completed the replenishment of assets following the $6.34 billion theft, activity on-chain has not quieted down. Blockchain analytics firm Elliptic tracked hackers linked to North Korea moving around 488,000 ETH (about $860 million) in four days, with the funds flowing through cross-chain and mixing routes. This potential selling pressure is hanging over the market and is one reason ETH has fallen significantly more than BTC.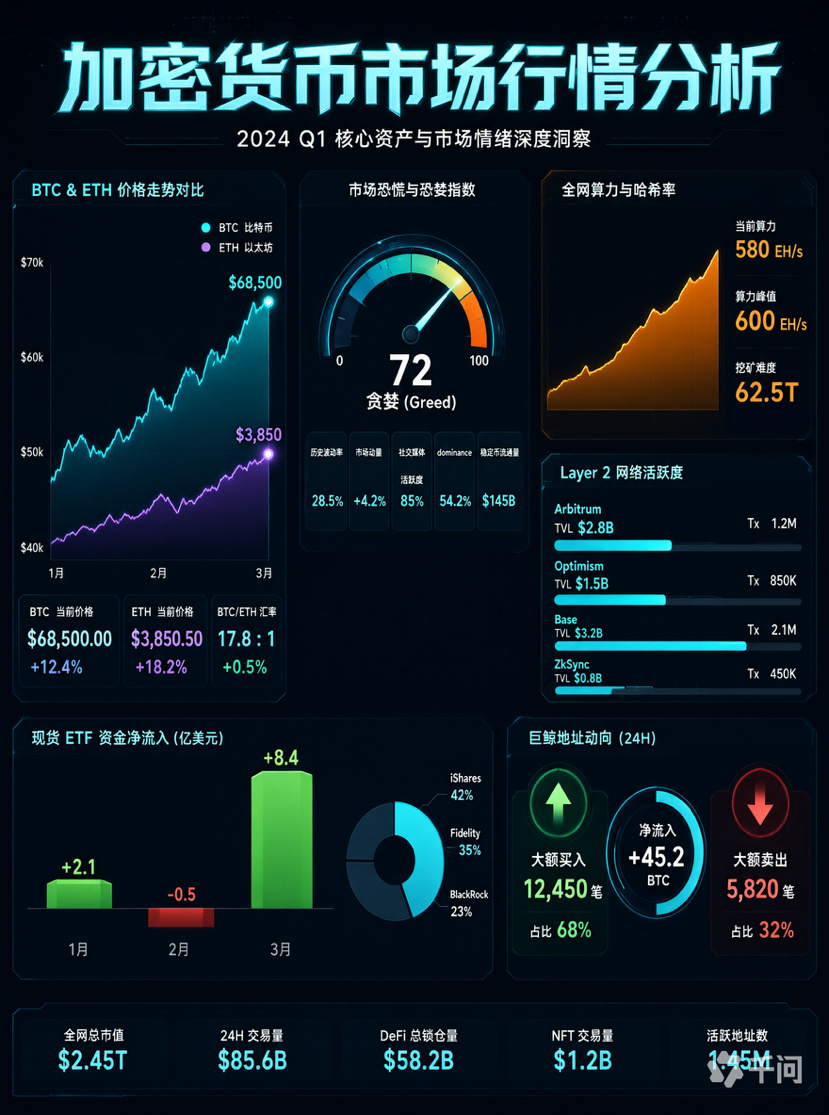
III. Leverage: fast money has been drained, but stability has not followed
Around $1.893 billion in crypto futures positions were liquidated across the market over the past 24 hours, affecting about 290,000 traders, with long positions accounting for as much as 91%. Depending on the data source, the number of liquidated traders ranged from 290,000 to 350,000. During the most volatile hour, Binance, Bybit, and OKX alone liquidated a combined roughly $94.6 million in Bitcoin positions. Kaiko analyst Andrew Yang put it well: leverage was key to this rapid decline—a break below a key level leads to long liquidations, which drive prices lower, triggering a chain reaction.
Leverage has indeed been drained: open interest in Bitcoin futures across the market has fallen to around $40 billion, its lowest level since November 2024. ETH funding rates have turned negative, with short sellers paying long holders. But note this counterintuitive fact: exhausted leverage does not mean the decline is over. It only removes the fuel for a “liquidation-driven plunge”; it does not solve the problem of “no one buying spot.” ETF outflows, miner selling, and depleted liquidity cannot be resolved simply by liquidations clearing the market.
IV. Technicals: Key levels, clearly marked
BTC. The daily RSI has fallen to the extreme oversold zone of 15–20, while the MACD histogram is still expanding. This means “the drop has been too fast,” not “the decline is over.” The first resistance above is around $59,600–$59,700, followed by the densely congested zones around $60,800 and $62,300. The first support below, near $56,300, is already in serious danger; below that, watch $54,700 and $53,000. From a broader perspective, the 200-week moving average near $68,000 has already been breached. Targets for a further decline from firms such as Wintermute point to the $50,000 range. Standard Chartered has also cut its year-end target from $150,000 to $100,000, warning that prices could first fall to slightly below $50,000 before rebounding.
ETH. On the 4-hour chart, the price is far below the SMA50 (around $1,839) and SMA200 (around $2,181), with strong resistance around $1,792. Near-term support is at $1,536–$1,540; if that fails, the next level to watch is the round-number $1,500 mark. Derivatives data shows a concentration of short liquidations around $1,668 and long liquidations around $1,537. The max pain level for options expiring November 22 is $1,680. This means a rebound into the $1,650–$1,700 range could face pressure and pull back, while another 3% drop could trigger a new cascade of long liquidations.
V. Trading strategy: at this level, discipline matters more than courage
Spot and long-term investors. Historical data for periods of extreme fear is indeed somewhat positive, but “extreme fear” can persist for weeks, and the index is a sentiment tool, not a timing indicator. A sensible approach is to dollar-cost average in batches, splitting your position into several parts and placing staggered orders below $56,000, at $53,000–$54,000, and around the $50,000 mark, rather than going all in while prices are falling. The signals that confirm a “bottom” are not price-based, but the simultaneous appearance of three things: ETF flows turning positive, order-book depth recovering, and BTC’s correlation with U.S. stocks declining. Without all three, it is just a rebound.
Futures and short-term trading. The costliest mistake right now is chasing the market. Chasing shorts in the extreme oversold zone, with an RSI of 15, risks getting stopped out by a bounce at any moment; chasing longs means trying to catch a falling knife in a downtrend. A more prudent approach is to wait for structural signals: only after a high-volume recovery and hold above $60,000–$60,800 on the 4-hour chart can we say the short-term structure has repaired, with a target near $62,000. If rebounds repeatedly meet resistance at $59,600–$60,000, a second test below $56,000, or even $54,700, is likely. Long positions must have a stop-loss, placed where the rationale for entry is invalidated (for example, a daily candle closing below the previous low), not at a “psychological pain threshold.” Keep leverage below one-third of your usual level. With market depth down 38%, the same order can cause twice the slippage.
Three hard rules for position management. First, keep total risk exposure within your predetermined share of investable capital. In a sharp downturn, staying in the game matters more than making big profits. Second, avoid large market orders during the least liquid periods (early hours on weekends and around major data releases). Third, keep your exchange balances in USDT/USDC separate from your cold-wallet holdings. After the Binance incident, this is no longer optional.
VI. Macroeconomic variables: officials sound more hawkish, but market pricing is cooling—watch this divergence
This is currently the most intriguing part. On the one hand, on November 21, Fed Governor Cook still said that a 25-basis-point rate hike in September was insufficient to ease inflation and that further hikes were needed immediately. Governor Waller had even suggested that a one-time 50-basis-point hike in December could be considered, while the October meeting minutes showed that almost all officials believed further rate hikes might be appropriate. On the other hand, after the November 19 minutes were released, CME pricing put the probability of a 25-basis-point rate hike in December at around 92.7%. But by Friday evening, OIS contracts tied to the December meeting showed that traders were no longer fully pricing in a hike. The rate-hike premium had fallen to 23 basis points, with the market broadly reducing its bets on another hike.
Officials are hawkish, but market pricing is softening. This kind of divergence usually points to two things: first, prices have already priced in a considerable amount of tightening expectations; second, the December 8–9 FOMC meeting has become the biggest source of volatility. If the Fed ultimately raises rates by just 25 basis points and does not toughen its language further, a “sell the rumor, buy the news” rebound is possible. If a 50-basis-point option is seriously discussed, then the $50,000 range is no exaggeration.
VII. Watchlist (ranked by importance)
First, daily ETF flows, especially whether IBIT’s redemptions stop—this is the only hard indicator determining the medium-term direction. Second, whether the $56,000–$54,700 zone holds and produces a high-volume long lower wick, with enough volume to confirm that panic selling is being absorbed. Third, whether U.S. stocks, particularly the Nasdaq and Nvidia, stabilize, and whether BTC’s correlation with equities declines. Fourth, whether the movement of stolen funds linked to ETH slows, and whether ETH ETFs continue to see net outflows (about $13.2 million in net outflows on November 19 alone, and around $217 million in net outflows for the week). Fifth, inflation and employment data ahead of the December FOMC meeting, as well as signals about the real economy in the Beige Book.
VIII. Sentiment: fear is the consensus; the disagreement is about the bottom
Community discussion is almost entirely focused on the battle over key levels after the break below $60,000, with most attributing the decline to a broad risk-asset sell-off triggered by the plunge in U.S. AI stocks. Bears argue that the trend has not reversed and positions should be controlled; bulls say that automatic liquidations during low-liquidity periods do not signal a worsening trend, and that the market will be cleaner once leverage has been flushed out. Another camp questions Bitcoin’s safe-haven status—gold and silver falling at the same time has indeed weakened the “digital gold” narrative. There is also an unusual split among institutions: Fairlead believes the market has entered a range, with the lower bound below $60,000; Wincent says ETF outflows show institutions have not truly stepped in; and GSR stresses that Bitcoin typically performs poorly in a deleveraging environment.
In a nutshell: this is not a collapse in fundamentals; it is the leg with the least cash-flow support being cut off in a “rates-driven market.” Prices can fall into opportunity, but that opportunity belongs only to those who have cash on hand and stick to their discipline. The most important thing now is not to guess the bottom, but to clearly define your positions, stop-losses, and indicators to watch—and act only when the signals appear.#比特币跌破6万美元,短期能否企稳反弹? #全球股市创三年来最长连跌,投资者避险情绪升温 #Anthropic上市次日大跌,股价接近破发 #TwentyOneCapital增持172.25枚BTC #香港代币化存款拟不列虚拟资产 $BTC



