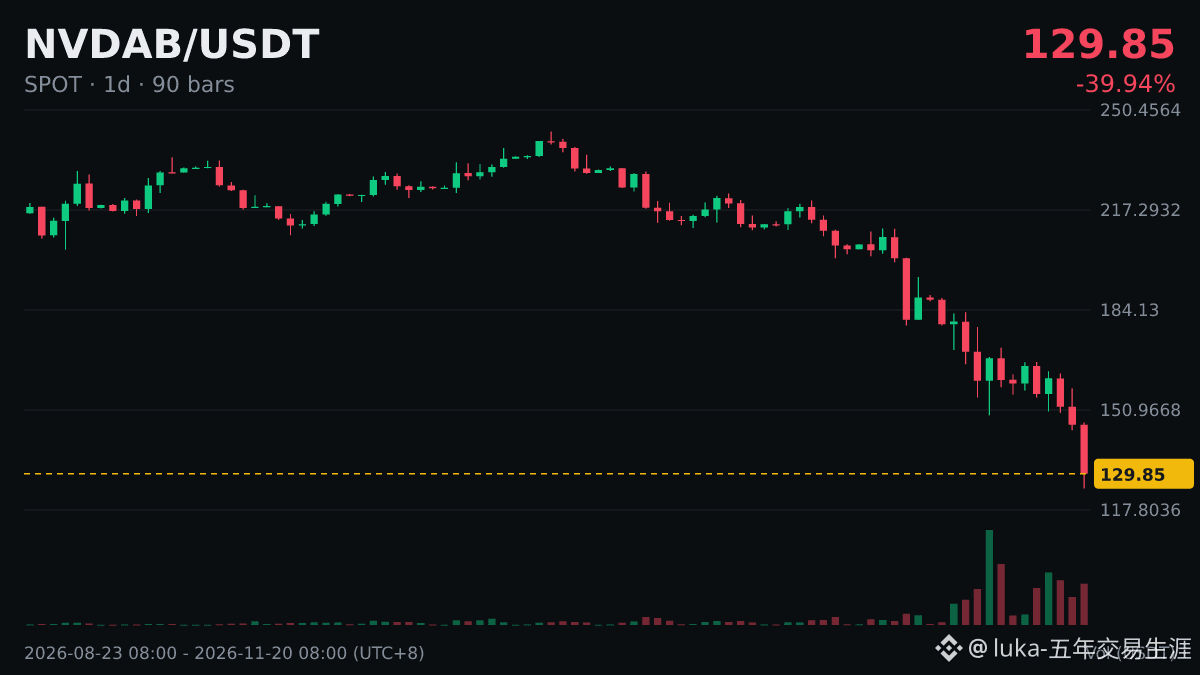
A quick note: $NVDAB daily RSI is 21.4, entering oversold territory, with the current price at 129.86.
People often ask how to interpret RSI, so here's my take.
The 14 in RSI means 14 candles: on a 4-hour chart, that's a little over two days (56 hours), while on a daily chart, it's exactly two weeks.
During a one-sided rally, RSI can stay above 70 for quite a while; during a sustained decline, it can also remain below 30 for a long time. Overbought or oversold conditions don't mean an immediate reversal.
Extreme readings usually signal more intense volatility. At times like these, it's better to reduce your position rather than add to it.
#NVDAB
People often ask how to interpret RSI, so here's my take.
The 14 in RSI means 14 candles: on a 4-hour chart, that's a little over two days (56 hours), while on a daily chart, it's exactly two weeks.
During a one-sided rally, RSI can stay above 70 for quite a while; during a sustained decline, it can also remain below 30 for a long time. Overbought or oversold conditions don't mean an immediate reversal.
Extreme readings usually signal more intense volatility. At times like these, it's better to reduce your position rather than add to it.
#NVDAB