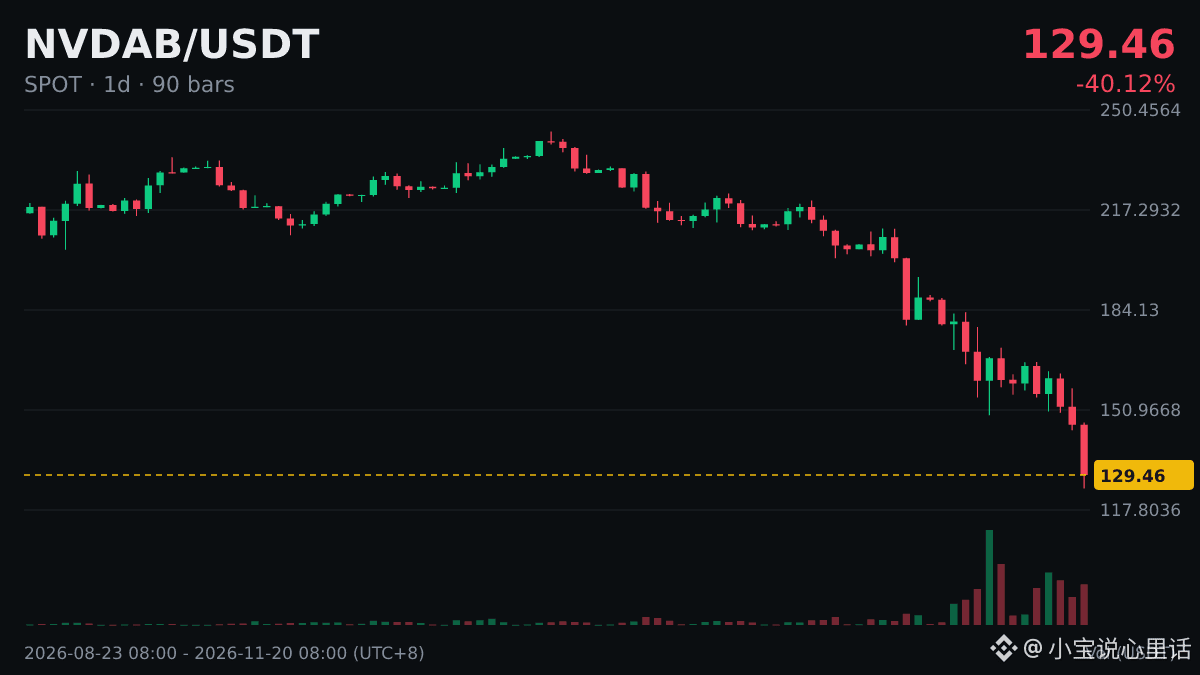
$NVDAB Daily RSI is 21.3, entering oversold territory.
Let's use this data to talk about RSI.
The 14 in RSI means 14 candlesticks: on a 4-hour chart, that corresponds to a little over two days (56 hours); on a daily chart, that's two weeks.
When RSI enters overbought or oversold territory, a more prudent response is to first think through the big-picture trend, where the key support levels are, and whether your position can withstand a further move.
Learning to read indicators is easy; the hard part is sticking to your rules when emotions are at their most extreme.
#NVDAB
Let's use this data to talk about RSI.
The 14 in RSI means 14 candlesticks: on a 4-hour chart, that corresponds to a little over two days (56 hours); on a daily chart, that's two weeks.
When RSI enters overbought or oversold territory, a more prudent response is to first think through the big-picture trend, where the key support levels are, and whether your position can withstand a further move.
Learning to read indicators is easy; the hard part is sticking to your rules when emotions are at their most extreme.
#NVDAB