
$SOXSB just rallied 31% in 24 hours. Here is what the charts say, without the hype. 📊
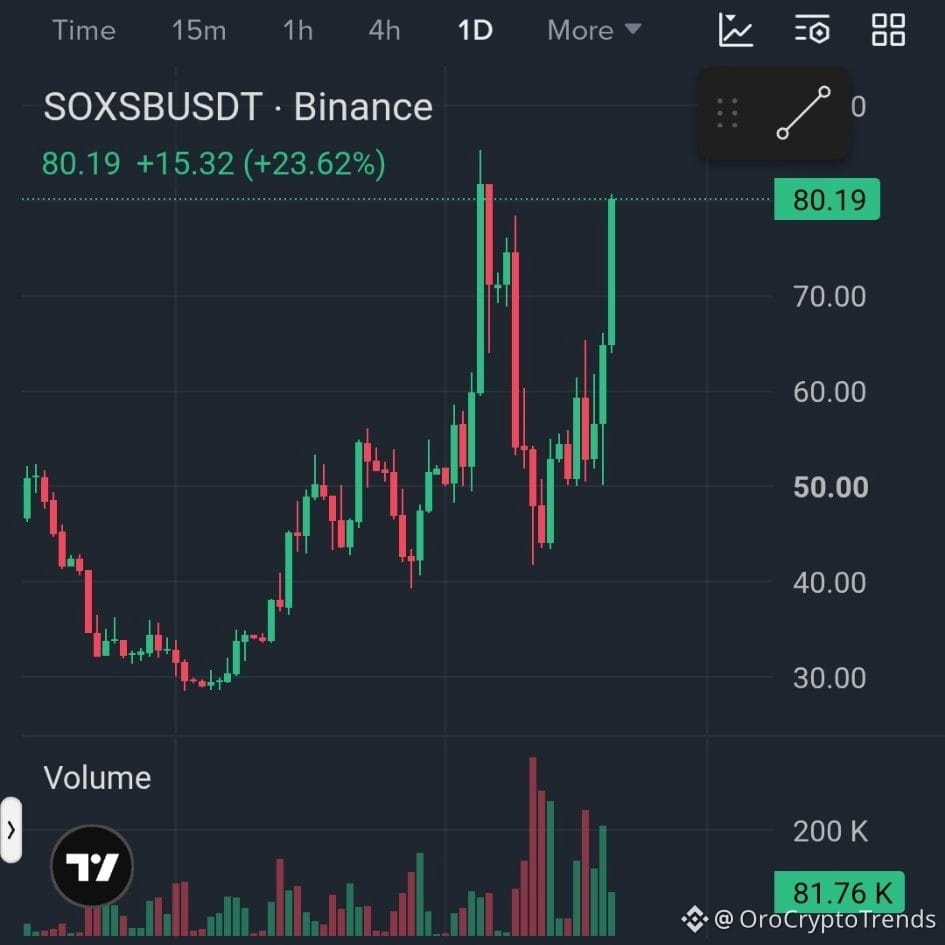
SOXSB is the tokenized Direxion Semiconductor Bear 3X ETF (SOXS) on Binance. It rises when chip stocks fall. After the sharp semiconductor selloff in early November, it has moved from about 30 in October to about 80 today.
According to Binance market data (SOXSB/USDT, 15m to 1D charts), price is near 80.3 with a 24h range of 60.08 to 80.67 and about 6.7M USDT in 24h volume. SOXS itself is up about 27% on the same day.
What the charts show:
🔹 1D: A higher-low recovery from the October base. Price is now back at the November spike zone, in the mid-80s.
🔹 4h / 1h: A staircase of higher highs and higher lows, with a near-vertical last leg from about 50 to 80.
🔹 15m: Price pulled back to about 76–77 and is retesting the 24h high at 80.67 as volume fades.
Levels I’m watching:
✅ Resistance: 80.67, then 84–86
✅ Support: 76–77, then 72–75, then 60–62
Scenarios:
📈 Hold 76–77 and close above 80.67, and the 84–86 zone comes into play.
📉 Lose 76–77 on volume, and a deeper retest of 72–75 or 60–62 is possible.
The PHLX Semiconductor Index dropped 12.25% on Nov 5, one of the worst days on record for chip stocks. SOXSB is a leveraged inverse product tied to that sector.
SOXS resets its leverage daily, so volatility decay can erode returns over longer holds. A 31% move in a day also means pullbacks can be fast. Manage position size, and don’t chase.
This is a chart study based on my own reading of price action, not financial advice. Always do your own research. 🔍
What’s your view: continuation or cooldown? Share it below 👇
$SOXSB
#SOXSB #bStocks
SOXSB is the tokenized Direxion Semiconductor Bear 3X ETF (SOXS) on Binance. It rises when chip stocks fall. After the sharp semiconductor selloff in early November, it has moved from about 30 in October to about 80 today.
According to Binance market data (SOXSB/USDT, 15m to 1D charts), price is near 80.3 with a 24h range of 60.08 to 80.67 and about 6.7M USDT in 24h volume. SOXS itself is up about 27% on the same day.
What the charts show:
🔹 1D: A higher-low recovery from the October base. Price is now back at the November spike zone, in the mid-80s.
🔹 4h / 1h: A staircase of higher highs and higher lows, with a near-vertical last leg from about 50 to 80.
🔹 15m: Price pulled back to about 76–77 and is retesting the 24h high at 80.67 as volume fades.
Levels I’m watching:
✅ Resistance: 80.67, then 84–86
✅ Support: 76–77, then 72–75, then 60–62
Scenarios:
📈 Hold 76–77 and close above 80.67, and the 84–86 zone comes into play.
📉 Lose 76–77 on volume, and a deeper retest of 72–75 or 60–62 is possible.
The PHLX Semiconductor Index dropped 12.25% on Nov 5, one of the worst days on record for chip stocks. SOXSB is a leveraged inverse product tied to that sector.
SOXS resets its leverage daily, so volatility decay can erode returns over longer holds. A 31% move in a day also means pullbacks can be fast. Manage position size, and don’t chase.
This is a chart study based on my own reading of price action, not financial advice. Always do your own research. 🔍
What’s your view: continuation or cooldown? Share it below 👇
$SOXSB
#SOXSB #bStocks