Bitcoin Breaks Its Weekend Low: What the Data Says Now
$BTC closed Thursday at about $61,900,
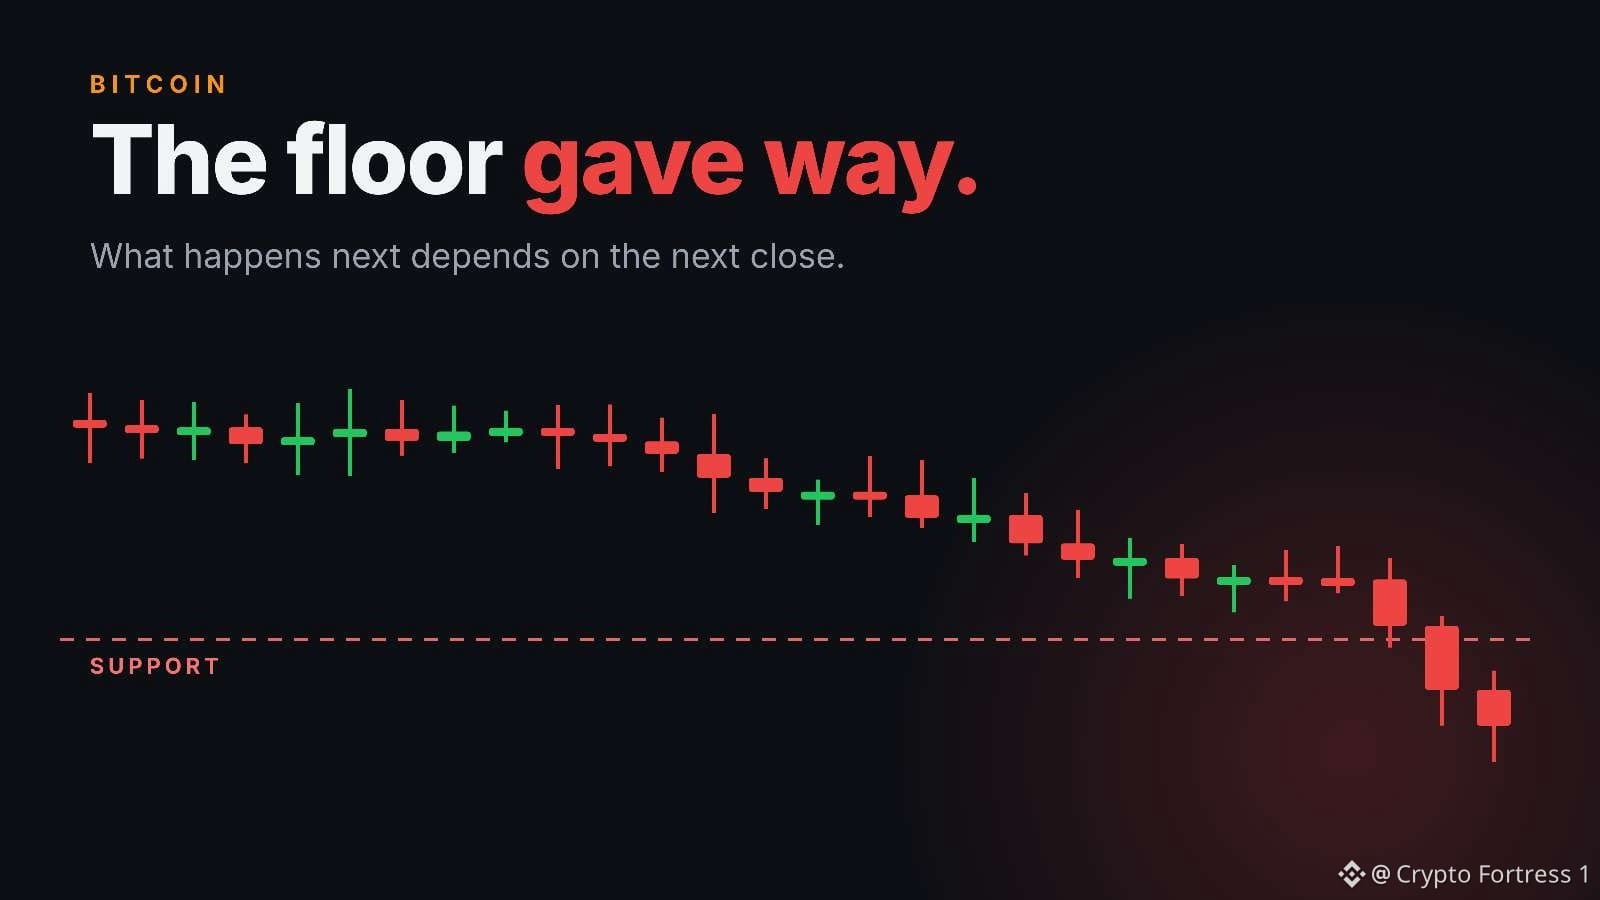
below Sunday's low of $61,970, and is trading near $62,000. That is a new multi-month low, and the move fits the pattern of lower highs: $65,379 on Tuesday, $64,928 on Wednesday, $64,014 on Thursday.
Price: The 20-day average sits near $71,900, and Bitcoin is below it and every other major average. Support is $61,353, then $61,213. A daily close back above $61,970 would reclaim the weekend low. Resistance is $63,272, then $64,014.
Positioning: Glassnode said $64,000 had to hold to form a solid bottom, and $62,000-$66,000 was where recent buyers were concentrated. Price is now below that range, which puts those holders at a loss. The next reference is the June low near $58,500.
Flows: U.S. spot ETFs lost $2.35B through November 13, plus about $240M on Nov 17 and $306M on Nov 18. Outflows came on 12 of the last 14 days.
Macro: October's Fed minutes showed "almost all participants" saw further hikes as appropriate. Futures price roughly 95% odds of 25bp on Dec 9, and Waller has argued for 50bp unless the Fed signals January.
Anthropic's IPO added a liquidity debate. ANT first traded at $111.50, closed at $97.17, and Bitcoin slid the same day. There is no data showing the two are linked.
What would change the view: a daily close above $64,000 and ETF inflows, or a close below $61,353 with rising liquidations, which opens $58,500.
Which side of $62,000 do you trade?
#BTC Price Analysis# #Bitcoin Price Prediction: What is Bitcoins next move?#
$BTC closed Thursday at about $61,900,
below Sunday's low of $61,970, and is trading near $62,000. That is a new multi-month low, and the move fits the pattern of lower highs: $65,379 on Tuesday, $64,928 on Wednesday, $64,014 on Thursday.
Price: The 20-day average sits near $71,900, and Bitcoin is below it and every other major average. Support is $61,353, then $61,213. A daily close back above $61,970 would reclaim the weekend low. Resistance is $63,272, then $64,014.
Positioning: Glassnode said $64,000 had to hold to form a solid bottom, and $62,000-$66,000 was where recent buyers were concentrated. Price is now below that range, which puts those holders at a loss. The next reference is the June low near $58,500.
Flows: U.S. spot ETFs lost $2.35B through November 13, plus about $240M on Nov 17 and $306M on Nov 18. Outflows came on 12 of the last 14 days.
Macro: October's Fed minutes showed "almost all participants" saw further hikes as appropriate. Futures price roughly 95% odds of 25bp on Dec 9, and Waller has argued for 50bp unless the Fed signals January.
Anthropic's IPO added a liquidity debate. ANT first traded at $111.50, closed at $97.17, and Bitcoin slid the same day. There is no data showing the two are linked.
What would change the view: a daily close above $64,000 and ETF inflows, or a close below $61,353 with rising liquidations, which opens $58,500.
Which side of $62,000 do you trade?
#BTC Price Analysis# #Bitcoin Price Prediction: What is Bitcoins next move?#