

The hardest part of this downturn isn’t how far prices have fallen, but that it hasn’t given you a moment to catch your breath.
U.S. stocks, gold, silver, copper, and crypto assets have almost all fallen across the board. From November 19 to 20, spot gold briefly fell to around $3,525/oz, its lowest level since September 2025, bringing its cumulative decline this quarter to about 15%; silver fell to $41.25, platinum to $1,299, and LME copper was down nearly 9% for the week. The crypto market was no exception: Bitcoin was trading at around $61,800 on November 20, after touching a 7-day low of $61,300, with a cumulative decline of about 28% this quarter.
This is not a problem confined to a single sector, but a battle for dollar liquidity across asset classes.
I. Why are gold and Bitcoin falling together? The answer lies in interest rates
Many people are still trying to understand this market action through the lens of “safe-haven assets,” but the reality is that when real interest rates keep rising, gold and Bitcoin are sold off together.
What they have in common is that they offer no intrinsic yield, have no underlying cash flows, and generate no earnings. When the U.S. 10-year Treasury yield stays above 5.0%, and markets even begin pricing in the possibility of a 50-basis-point Fed rate hike in December, the “opportunity cost” of holding these assets rises sharply.
Rising rate-hike expectations are not coming out of nowhere. U.S. core CPI rose 0.3% month over month for the third consecutive month in October, and inflation remains well above the Fed’s 2% long-term target. Fed Vice Chair Jefferson said the inflation trajectory is a key signal for assessing monetary policy; Boston Fed President Collins said rates may need to rise more than expected; and Governor Waller even argued that a 50-basis-point hike should be considered if core inflation remains above 0.3%. CME FedWatch data showed the probability of a 25-basis-point rate hike in December briefly rose above 88%, while the probability of a 50-basis-point hike reached 11.7%.
The deeper chain of transmission is: AI bubble concerns → technology stock sell-offs → investors forced to sell gold and crypto assets to cover losses → a surge in demand for dollar liquidity → emerging-market assets sold off → a broad retreat in global risk appetite. Bloomberg noted that investors are selling gold to cover losses from falling AI stocks, which explains why even traditional safe-haven assets are under pressure.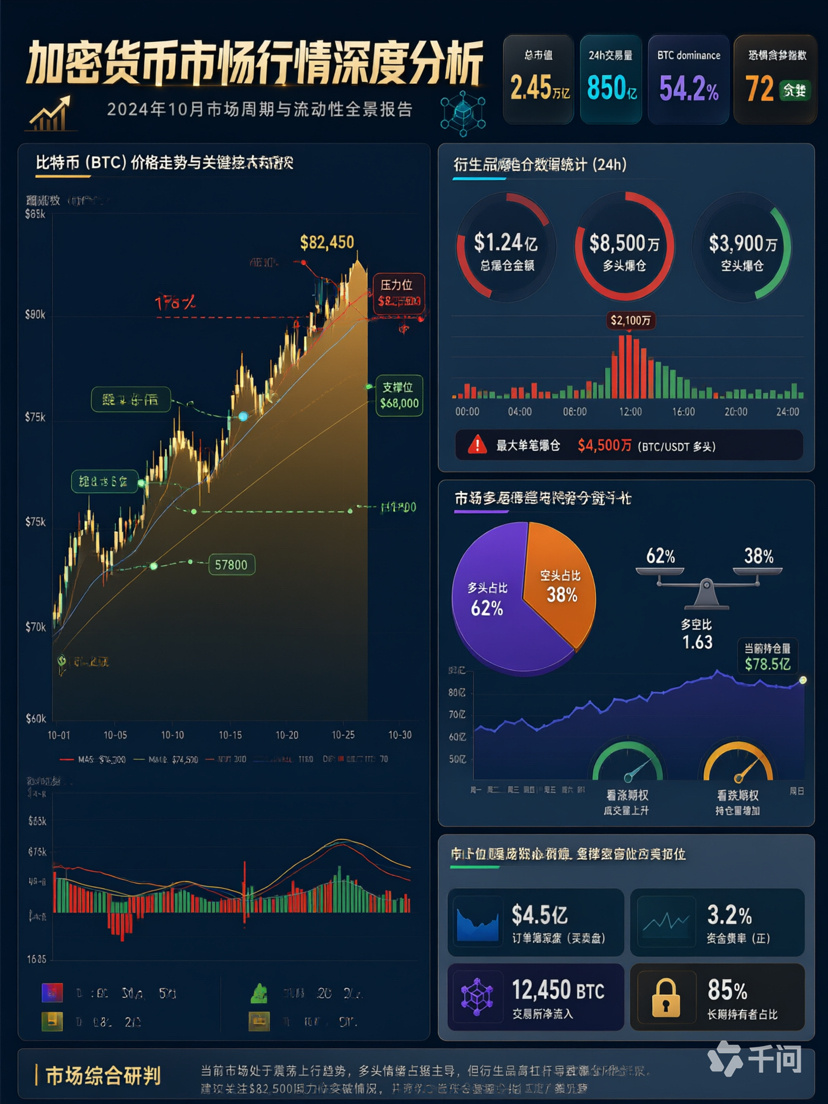
II. Technical analysis: What does a break below the 200-week moving average mean?
On November 17, Bitcoin officially fell below its 200-week moving average, the most important technical signal in this downturn.
Historically, the 200-week moving average has been regarded as Bitcoin’s “lifeline”—the strongest support in a bull market and the toughest resistance to overcome in a bear market. During the 2022 bear market, Bitcoin entered a year-long deep correction after breaking below the 200-week moving average. Matthew Sigel, head of digital asset research at VanEck, warned that the current situation resembles late 2022 and early 2023—the final stage before the previous uptrend ended.
Wintermute’s analysis is more direct: Bitcoin’s recent rebound above $64,500 was driven more by short sellers closing their positions than by new money entering the market. To confirm that long-term support has re-formed, Bitcoin must rise back to around $68,000, accompanied by fresh inflows into spot ETFs.
Looking at the market structure, your assessment that the structure was redrawn after the break below $71,800 is valid. But it is worth adding that the market is no longer asking “Can it get back to $71,800?” The question now is “Can $57,800 hold?”
III. $57,800: A confluence of miner costs, the power-law model, and historical support
The reason $57,800 has become the key battleground between bulls and bears this time is not simply a technical chart pattern; it reflects the convergence of several fundamental factors:
First, miner production costs. Schwab strategists estimate that the most efficient miners’ production costs are around $60,000, while the industry-wide average ranges from $52,000 to $70,000. When the price falls below miners’ average costs, selling pressure from miners decreases significantly—because the miners, who have the greatest incentive to hold, can no longer keep selling. JPMorgan data show that in June 2026, 20% of miners were operating at a loss and network hash rate had fallen 10%, with weaker miners exiting.
Second, support from the power-law model. The power-law model cited by Jurrien Timmer, Fidelity’s head of global macro, places the area around $58,000 at the lower end of its range. Historically, several market bottoms have formed there. Bitcoin’s current price is about 56% below the model’s median trend line, a deviation that closely resembles conditions in the 2018 and 2022 bear markets.
Third, on-chain cost support. The network-wide realized price is around $61,500, while the realized price for long-term holders (those who have held for more than 155 days) is about $48,800. This means structural holders still have 28% in unrealized profits and are not panic-selling. Current selling pressure is mainly coming from short-term holders (those who bought within the past 155 days), whose cost basis is around $74,300, leaving them all in unrealized losses.
But it is important to be cautious: Fidelity also warned that, without an injection of new liquidity, Bitcoin is highly likely to consolidate around $58,000 for several months rather than quickly reversing in a V-shaped recovery.
IV. Three scenarios and trading strategies
Based on current market conditions, the future price action can broadly be divided into three scenarios:
Scenario 1 (about 30% probability): $61,000 holds, with a rebound followed by another test of the lows
If support forms around $61,000, BTC may first rebound to test trend-line resistance at $65,800. A breakout would provide further confirmation of the lower boundary of the $72,000 channel, after which the price could pull back again to test $57,800. This path would be relatively favorable for bulls, providing a window to reduce or adjust positions.
Scenario 2 (about 50% probability): Weak consolidation followed by a direct break below $60,000 and a test of $57,800
This is currently the most likely path. With ETF outflows continuing and rate-hike expectations elevated, the market lacks the momentum to rebound. It could fall straight through the psychological $60,000 level and test support at $57,800. If a double bottom forms there, or the price briefly dips below support before quickly recovering, the rebound could be strong. This could be viewed as a second test of the lows following the rally from $57,800, with a potential move back toward $72,000 afterward.
Scenario 3 (about 20% probability): $57,800 decisively breaks, with a decline to $53,800 or even $46,000
If $57,800 is decisively broken and support around $55,800 also fails, the next level to watch is the annual MA7 support at $53,800. But a more likely possibility is that this coincides with an external black-swan event (such as a larger-than-expected 50-basis-point Fed rate hike or systemic risk triggered by the bursting of the AI bubble). In that case, Fibonacci extensions point to lower levels: the 0.5 level is around $46,600, the 0.618 level around $43,100, and the unfilled CME gap is near $42,000. The $42,000–$46,000 range could become the true broad area where the decline bottoms out.
V. Practical advice for different types of investors
For spot holders:
The Fear and Greed Index has remained in “Extreme Fear” territory at 15 for an extended period. Historically, this has often presented a medium- to long-term buying opportunity. However, given the adverse macroeconomic environment, consider dollar-cost averaging rather than committing a large position all at once: start building a position in tranches below $60,000, add a tranche for every 5%–8% decline, divide your capital into 6–8 portions, and be mentally prepared for a possible drop to $42,000. Fidelity also recommends dollar-cost averaging (DCA) or accumulating in stages.
For derivatives traders:
You must significantly reduce leverage. In an environment where open interest relative to market cap is near a one-year low but volatility remains intense, keep leverage to 3–5x or less, and size positions so that the maximum drawdown on your account does not exceed 2%–3% of total capital. Place stop-losses outside the liquidation clusters around $60,000 and $57,800. Also stay away from perpetual contracts on small-cap coins—extreme funding rates combined with thin liquidity can squeeze you from both sides.
For those holding no positions:
There’s no need to panic. The market is currently in a “liquidity drought dead zone”: no new money is coming in, so major players can only drain retail traders’ margin by whipping prices back and forth. Be patient and wait for direction: $68,000 (the 200-week moving average) is the level that would confirm a reversal, while $57,800 is a confluence of support from miner costs and the power-law model. Until these levels are decisively tested, watch more and trade less.
VI. Risks that must be taken seriously
Macroeconomic policy risk (currently the biggest risk): If the Fed raises rates more than expected in December (possibly even by 50 basis points), or its subsequent guidance is hawkish, the $60,000 support could be broken directly by an event-driven sell-off.
Liquidity spiral risk: When several asset classes fall at the same time, this can trigger a chain reaction—a loss in one market forces investors to sell other assets, further increasing demand for cash and creating a vicious cycle. The ECB has warned that geoeconomic risks, high AI valuations, and debt vulnerabilities could lead to a sudden repricing of assets.
Continued ETF outflows: From October 30 to November 13, U.S. spot Bitcoin ETFs saw nearly $3 billion in net outflows. Although November 16 ended a seven-day streak of outflows, a single day of net inflows is only a temporary reprieve. At least 3–5 consecutive days of inflows are needed before we can say demand has returned.
Regulatory compliance risk: It should be made clear that virtual currencies such as Bitcoin are not issued by monetary authorities and are not legal tender. Domestic regulators have repeatedly emphasized that conducting virtual-currency-related business in the country constitutes illegal financial activity and is strictly prohibited. This article discusses market structure and risk for informational purposes only and does not constitute investment advice.
The underlying cause of this downturn is not an internal problem in the crypto market, but the inevitable result of tightening global liquidity and repricing of interest rates. Bitcoin’s correlation with gold and technology stocks has risen to 0.6–0.7. It is no longer a “safe-haven asset” independent of traditional finance, but part of the global risk-asset universe.
Is $57,800 the bear-market bottom or merely a stop on the way down? The answer is not in the candlestick chart, but in the Fed’s rate-setting meeting, whether the AI bubble can land softly, and whether global dollar liquidity can ease again.
For most people, the most valuable thing to do right now is not to “buy the absolute bottom,” but to reduce leverage, write down position-sizing rules, stick to a regular-investment plan, and then wait.
Only those who survive make it to the next cycle. In a market where hundreds of millions of dollars in margin can still evaporate in 24 hours, this is not just a platitude—it is the only actionable strategy.#全球股市创三年来最长连跌,投资者避险情绪升温 #加息预期叠加美股分流,比特币跌破6.2万美元 #高腾比特币ETF登陆港交所 #新人宝典:从零了解TradFi #Ledger调查柏林遭篡改硬件钱包 $BTC



