
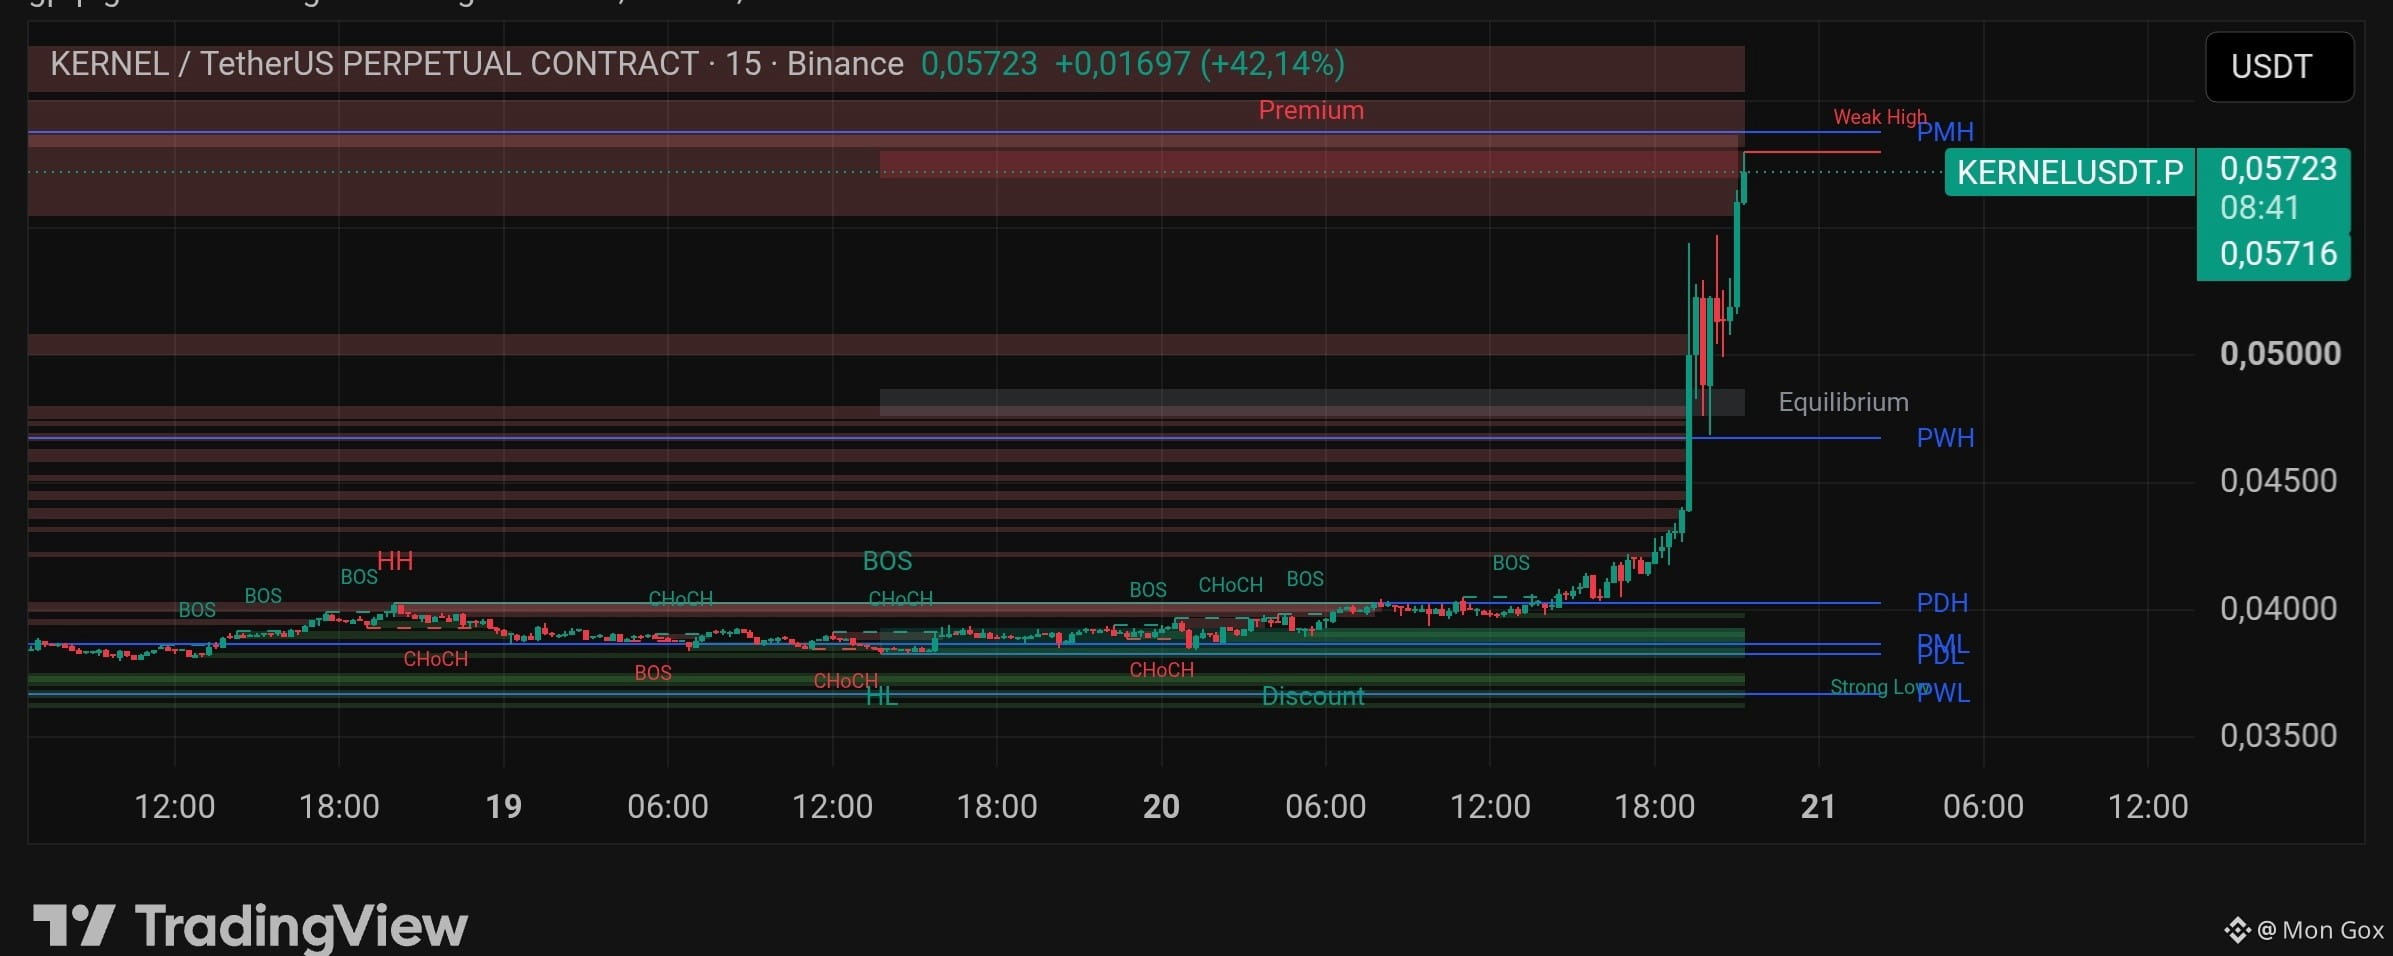

$KERNEL Up 45.6% in 24 hours and now at 0.05641, 2.4% below the 24-hour high of 0.05777. But the latest buying climax on the 5m chart appeared on the last candle, with volume 5.92x the average. Heavy volume has come in, and now the question is: is this a peak, or a pause before continuing higher? I don't know yet, but the levels are clear enough to check on the chart.
What happened on the 5m chart: first, two SOS at 0.05038 (vol 2.59x) and 0.05227 (vol 4.05x), two SC around 0.0513 (vol 2.38x and 2.41x), a BC at 0.05216 (vol 2.58x), then consecutive SOS at 0.05437 (vol 4.47x) and 0.05604 (vol 6.41x), ending with a BC at 0.0563 (vol 5.92x). The 5m phase is still MARKUP with an UP trend. The latest bullish BOS at 0.05474 and 0.05442 occurred just one candle ago, and price has already moved past them. Interestingly, the last candle's EVR is 5.6, and the model flags possible absorption. The volume is there, but the price movement hasn't kept pace. There is no SPRING or UTAD on the 5m chart to help determine the direction.
Above price (supply and magnets): price is currently inside two mitigated bear OBs. The first is on 1H, from 0.05340 to 0.05865 (strength 3, impulse 9.08%). The second is on 1D, from 0.05350 to 0.05702 (strength 2, impulse 8.67%). There are no open FVGs on 5m, 1H, or 4H above price. The nearest open FVG is on 1W, from 0.07396 to 0.07976. The nearest liquidity is a 4H BSL at 0.05702 (+1.1%) and a 4H BSL at 0.05746 (+1.9%), both recorded as x1. There is also major resistance at 0.05746, with 2 touches. The strongest confluence above is from 0.05877 to 0.05879, score 14.5, with five elements from 1D, 1H, 1W, 30D, and 4H, with a bearish bias. Above that are resistance levels at 0.05937 (3 touches, STRONG) and 0.06476 (8 touches, VERY STRONG).
Below price (support and magnets): the open 5m bull FVG from 0.0546 to 0.0559 is about 2% below price and overlaps with the 1D SSL at 0.0558. The 0.0558 area is a major confluence with a score of 9.5 (1D SSL and major support, TFs 1D, 1W, 30D), 1.1% below price. This is the area I’m watching most closely for a downside scenario. The NY session POC at 0.05596 is just above this area. Over the past 3 days, the POC is at 0.05179, the VAH at 0.05406, and the VAL at 0.04828. Price is already 4.3% above the VAH and 8.9% above the POC. Below, there is a high-priority 4H EQL x2 from 0.05303 to 0.05308. The support levels with the most touches are at 0.0449 (6 touches, VERY STRONG), 0.04435 (5 touches, VERY STRONG), and 0.04136 (4 touches, VERY STRONG). The 0.04961 support has only 2 touches (MODERATE).
Timeframe conflict: the bias for each TF is 5m BULLISH, 1H NEUTRAL, 4H BULLISH, 1D BEARISH, and 1W NEUTRAL. The system flags PARTIAL_ALIGNMENT_BULLISH. For the broader direction, I give more weight to the bearish 1D, since 1D printed a bearish BOS a few candles ago. Intraday, 5m and 4H remain bullish as long as the 4H structure holds. The Wyckoff phase on 5m, 1H, and 1D is MARKUP, but 4H is labeled MARKDOWN. I’m disregarding the 4H label because the 4H range high (0.05442) is already below price. The 1D and 1H Wyckoff projections point to 0.05746 (+1.9%). The 4H projection points down to 0.0558. For premium and discount, I’m using the 30-day range (price at 89%, premium) and the 90-day range (59%, upper neutral). I’m disregarding the 1D and 1W ranges because they are skewed by old extreme points.
Upside scenario: if 1H closes above 0.05746 and holds, the first target is 0.05878. After that, 0.05937, then 0.06476, which has the most touches. This scenario is invalidated if 1H closes below 0.0558.
Downside scenario: if 1H closes below 0.0558, that major confluence support is lost. Stepwise targets: the 3-day VAH at 0.05406, then the 4H EQL area from 0.05303 to 0.05308, followed by support at 0.04961 and 0.0449. This scenario is invalidated if price closes above 0.05878 and holds there.
My bias: I’m leaning toward a short-term upside scenario. Price is still above the 3-day VAH, and 5m and 4H remain bullish. I think 0.05746 will be tested again before a major decision is made. This view is invalidated if 1H closes below 0.0558 before price gets a chance to touch 0.05746. On the HTF, I remain skeptical while 1D is still bearish. The signal I’m waiting for most: price sweeps below 0.0558, then closes back above it.
I’ll check the results tomorrow, especially whether 0.05746 is broken by a close or 0.0558 gives way first. The reaction at this level can be tracked live on $KERNEL.
Disclaimer: this is technical analysis, not financial advice. Use a stop loss and reasonable position sizing.
