
$BTC
lost the $62K base. Now the multi-month floor is in play. 📉
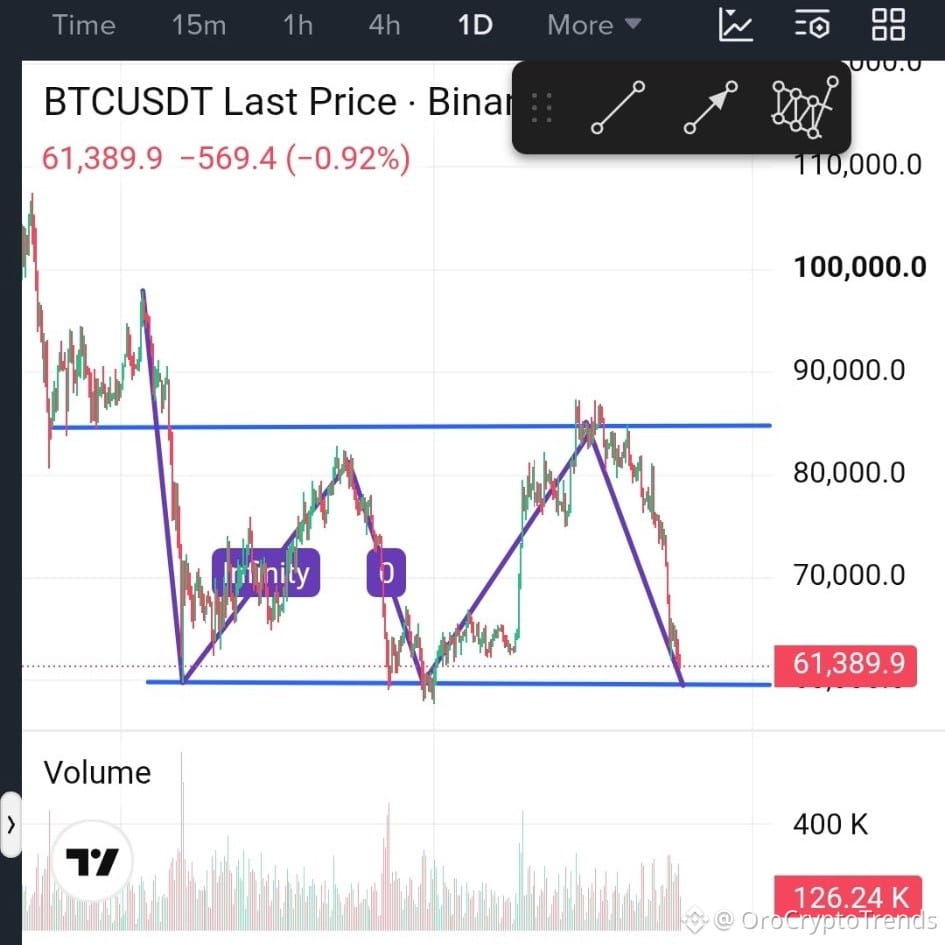
In my last post, a daily close below $62K was the bearish trigger, and price is now trading below it. According to Binance’s BTCUSDT Perpetual charts, BTC trades near $61,390, down about 14% over 7 days and 26% over 30 days, with a 24h range of $61,155 to $64,055.
What changed:
🔻 The $62K base broke. The bounce peaked at $64,055, then rolled over into lower highs near $62.3K. $62K is now resistance.
🔻 Lower timeframes are still trending down. The 4H and 1H candles are small and stair-stepping lower, which looks like orderly selling, not panic. There is no higher low or reclaimed level yet.
🔻 Daily floor retest. BTC has swung between roughly $60K and $85K-$87K for most of the year, and it is back at the bottom. Earlier tests, including the July wick, landed in the $58K-$62K area, so I’m treating it as a zone, not a single line.
🔻 Volume is not capitulation yet. Daily volume so far is about 126K BTC, far below the roughly 400K spike at the early-2026 low. That can mean the flush is still ahead, or that selling is exhausted. Volume alone can’t tell us which.
Levels to watch:
🟥 Resistance: $62K-$62.3K, $64K, $65.4K
🟩 Support: $61.15K, then $60K, then $57K-$58K
Bullish: A wick into $60K that gets bought, then a daily close back above $62K. That would turn this into a failed breakdown and put $64K and $65.4K in play.
Bearish: A daily close below $60K would break the multi-month floor and open $57K-$58K.
Unchanged: More small candles between $60.5K and $62.3K on light volume is just compression.
What I’m watching: today’s daily close relative to $62K and $60K, and whether any dip into $60K comes with a volume spike and a long lower wick, or just drifts through.
No hype and no prediction, just levels and conditions. A floor tested many times can still fail.
⚠️ This is a chart read, not financial advice. Manage your risk and do your own research.
What’s your read: does the $58K-$62K zone hold or give way? 👇
#BTC
lost the $62K base. Now the multi-month floor is in play. 📉
In my last post, a daily close below $62K was the bearish trigger, and price is now trading below it. According to Binance’s BTCUSDT Perpetual charts, BTC trades near $61,390, down about 14% over 7 days and 26% over 30 days, with a 24h range of $61,155 to $64,055.
What changed:
🔻 The $62K base broke. The bounce peaked at $64,055, then rolled over into lower highs near $62.3K. $62K is now resistance.
🔻 Lower timeframes are still trending down. The 4H and 1H candles are small and stair-stepping lower, which looks like orderly selling, not panic. There is no higher low or reclaimed level yet.
🔻 Daily floor retest. BTC has swung between roughly $60K and $85K-$87K for most of the year, and it is back at the bottom. Earlier tests, including the July wick, landed in the $58K-$62K area, so I’m treating it as a zone, not a single line.
🔻 Volume is not capitulation yet. Daily volume so far is about 126K BTC, far below the roughly 400K spike at the early-2026 low. That can mean the flush is still ahead, or that selling is exhausted. Volume alone can’t tell us which.
Levels to watch:
🟥 Resistance: $62K-$62.3K, $64K, $65.4K
🟩 Support: $61.15K, then $60K, then $57K-$58K
Bullish: A wick into $60K that gets bought, then a daily close back above $62K. That would turn this into a failed breakdown and put $64K and $65.4K in play.
Bearish: A daily close below $60K would break the multi-month floor and open $57K-$58K.
Unchanged: More small candles between $60.5K and $62.3K on light volume is just compression.
What I’m watching: today’s daily close relative to $62K and $60K, and whether any dip into $60K comes with a volume spike and a long lower wick, or just drifts through.
No hype and no prediction, just levels and conditions. A floor tested many times can still fail.
⚠️ This is a chart read, not financial advice. Manage your risk and do your own research.
What’s your read: does the $58K-$62K zone hold or give way? 👇
#BTC