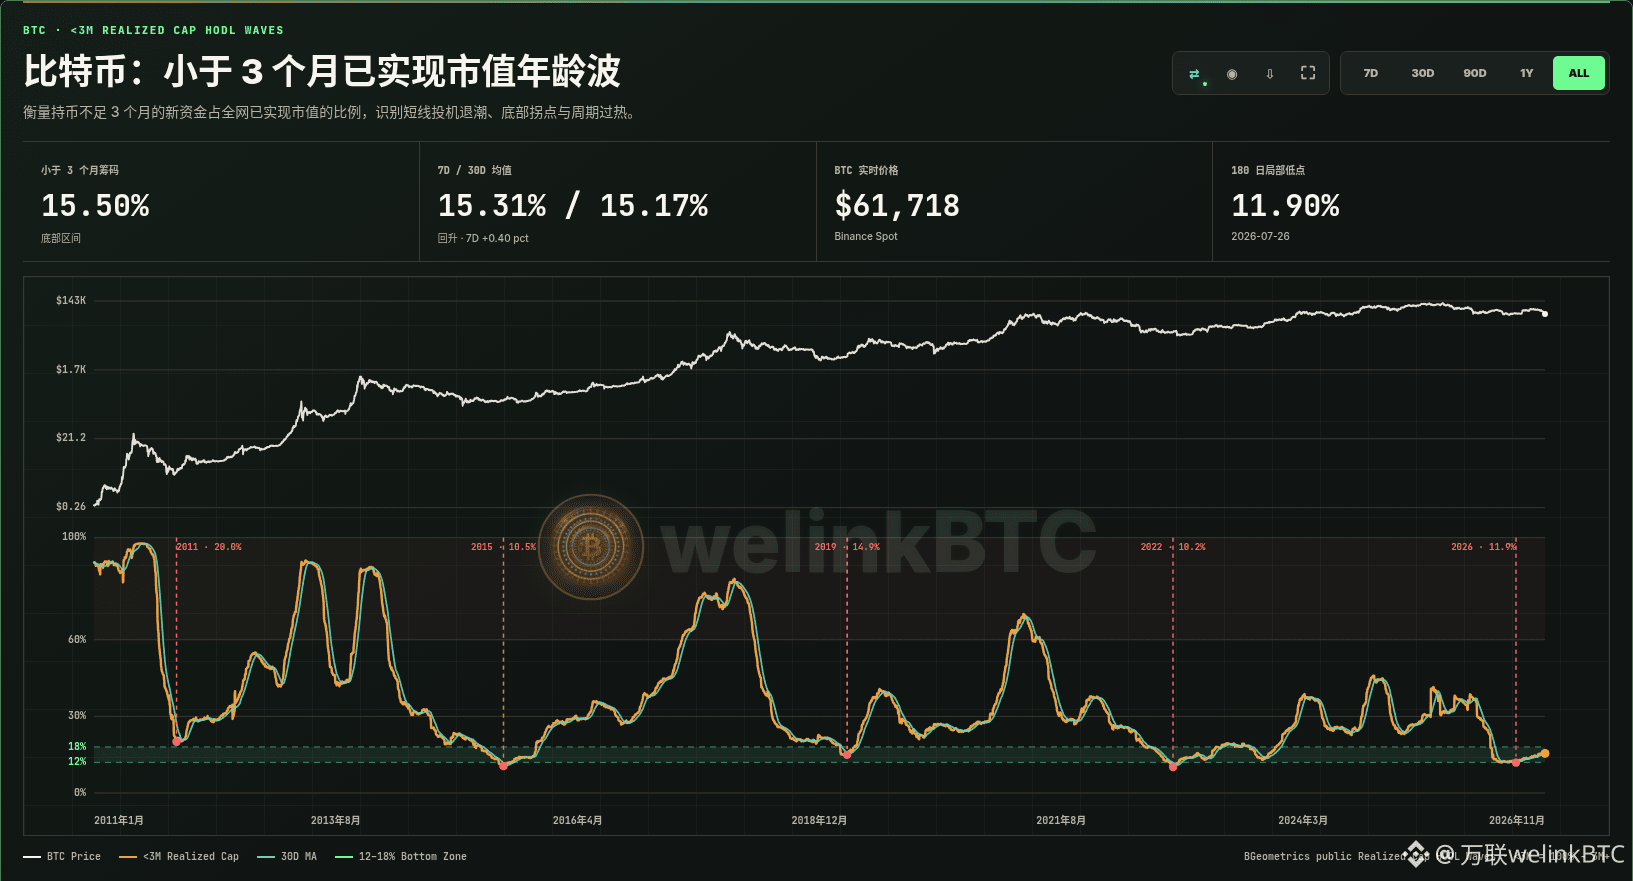
Bitcoin: Realized Cap HODL Waves, Age Band < 3 Months
The share of short-term capital held for less than 3 months remains in the bottom range, but has turned up from its recent 180-day low.
As of 2026-11-19, the share of short-term capital held for less than 3 months was 15.50%, with 7-day and 30-day averages of 15.31% and 15.17%, respectively. The 7-day change was +0.40 percentage points, leaving it 2.50 percentage points below the 18% bottom-range threshold. The recent 180-day low was 11.90%, reached on 2026-07-26. The BTC reference price is approximately $61,718. The chart shows that the bottom’s V-shaped turning point has been confirmed, with short-term capital shifting from net outflows to a modest return.
How should you read this indicator? The Realized Cap HODL Waves age band for coins held less than 3 months measures the share of the network’s cost-weighted realized capitalization represented by coins that last moved less than 3 months ago. A rising share indicates activity from new capital and hot money; a falling share indicates coins are settling into the hands of medium- and long-term holders. At or below 15% is a historically deep bottom, where short-term speculation has largely been flushed out; 15% to 18% is the bottom range, where to watch for a V-shaped turn and new capital entering; 18% to 30% is a transitional accumulation phase, with a modest return of short-term capital; above 60% indicates overheated speculation, when the risk of distribution near a top warrants attention.
Across historical cycles, the lows in 2011, 2015, 2019, 2022, and the current cycle have mostly fallen within an extremely low range of approximately 12% to 18%: 20.0% in 2011 (corresponding to about $2), 10.5% in 2015 (about $243), 14.9% in 2019 (about $4,094), 10.2% in 2022 (about $19,341), and a low of 11.9% in the current cycle on 2026-07-26 (about $65,329).
A low reading in itself signals that speculation is cooling off; a sustained rise afterward is stronger evidence that short-term players are shifting from net outflows to net inflows. If spot demand recovers at the same time, even a small amount of new buying can more easily amplify price movements.
More selected on-chain cycle indicators
Portal: https://welinkbtc-onchainmain.xyz/
Understand market cycles like a professional analyst
$BTC
The share of short-term capital held for less than 3 months remains in the bottom range, but has turned up from its recent 180-day low.
As of 2026-11-19, the share of short-term capital held for less than 3 months was 15.50%, with 7-day and 30-day averages of 15.31% and 15.17%, respectively. The 7-day change was +0.40 percentage points, leaving it 2.50 percentage points below the 18% bottom-range threshold. The recent 180-day low was 11.90%, reached on 2026-07-26. The BTC reference price is approximately $61,718. The chart shows that the bottom’s V-shaped turning point has been confirmed, with short-term capital shifting from net outflows to a modest return.
How should you read this indicator? The Realized Cap HODL Waves age band for coins held less than 3 months measures the share of the network’s cost-weighted realized capitalization represented by coins that last moved less than 3 months ago. A rising share indicates activity from new capital and hot money; a falling share indicates coins are settling into the hands of medium- and long-term holders. At or below 15% is a historically deep bottom, where short-term speculation has largely been flushed out; 15% to 18% is the bottom range, where to watch for a V-shaped turn and new capital entering; 18% to 30% is a transitional accumulation phase, with a modest return of short-term capital; above 60% indicates overheated speculation, when the risk of distribution near a top warrants attention.
Across historical cycles, the lows in 2011, 2015, 2019, 2022, and the current cycle have mostly fallen within an extremely low range of approximately 12% to 18%: 20.0% in 2011 (corresponding to about $2), 10.5% in 2015 (about $243), 14.9% in 2019 (about $4,094), 10.2% in 2022 (about $19,341), and a low of 11.9% in the current cycle on 2026-07-26 (about $65,329).
A low reading in itself signals that speculation is cooling off; a sustained rise afterward is stronger evidence that short-term players are shifting from net outflows to net inflows. If spot demand recovers at the same time, even a small amount of new buying can more easily amplify price movements.
More selected on-chain cycle indicators
Portal: https://welinkbtc-onchainmain.xyz/
Understand market cycles like a professional analyst
$BTC