
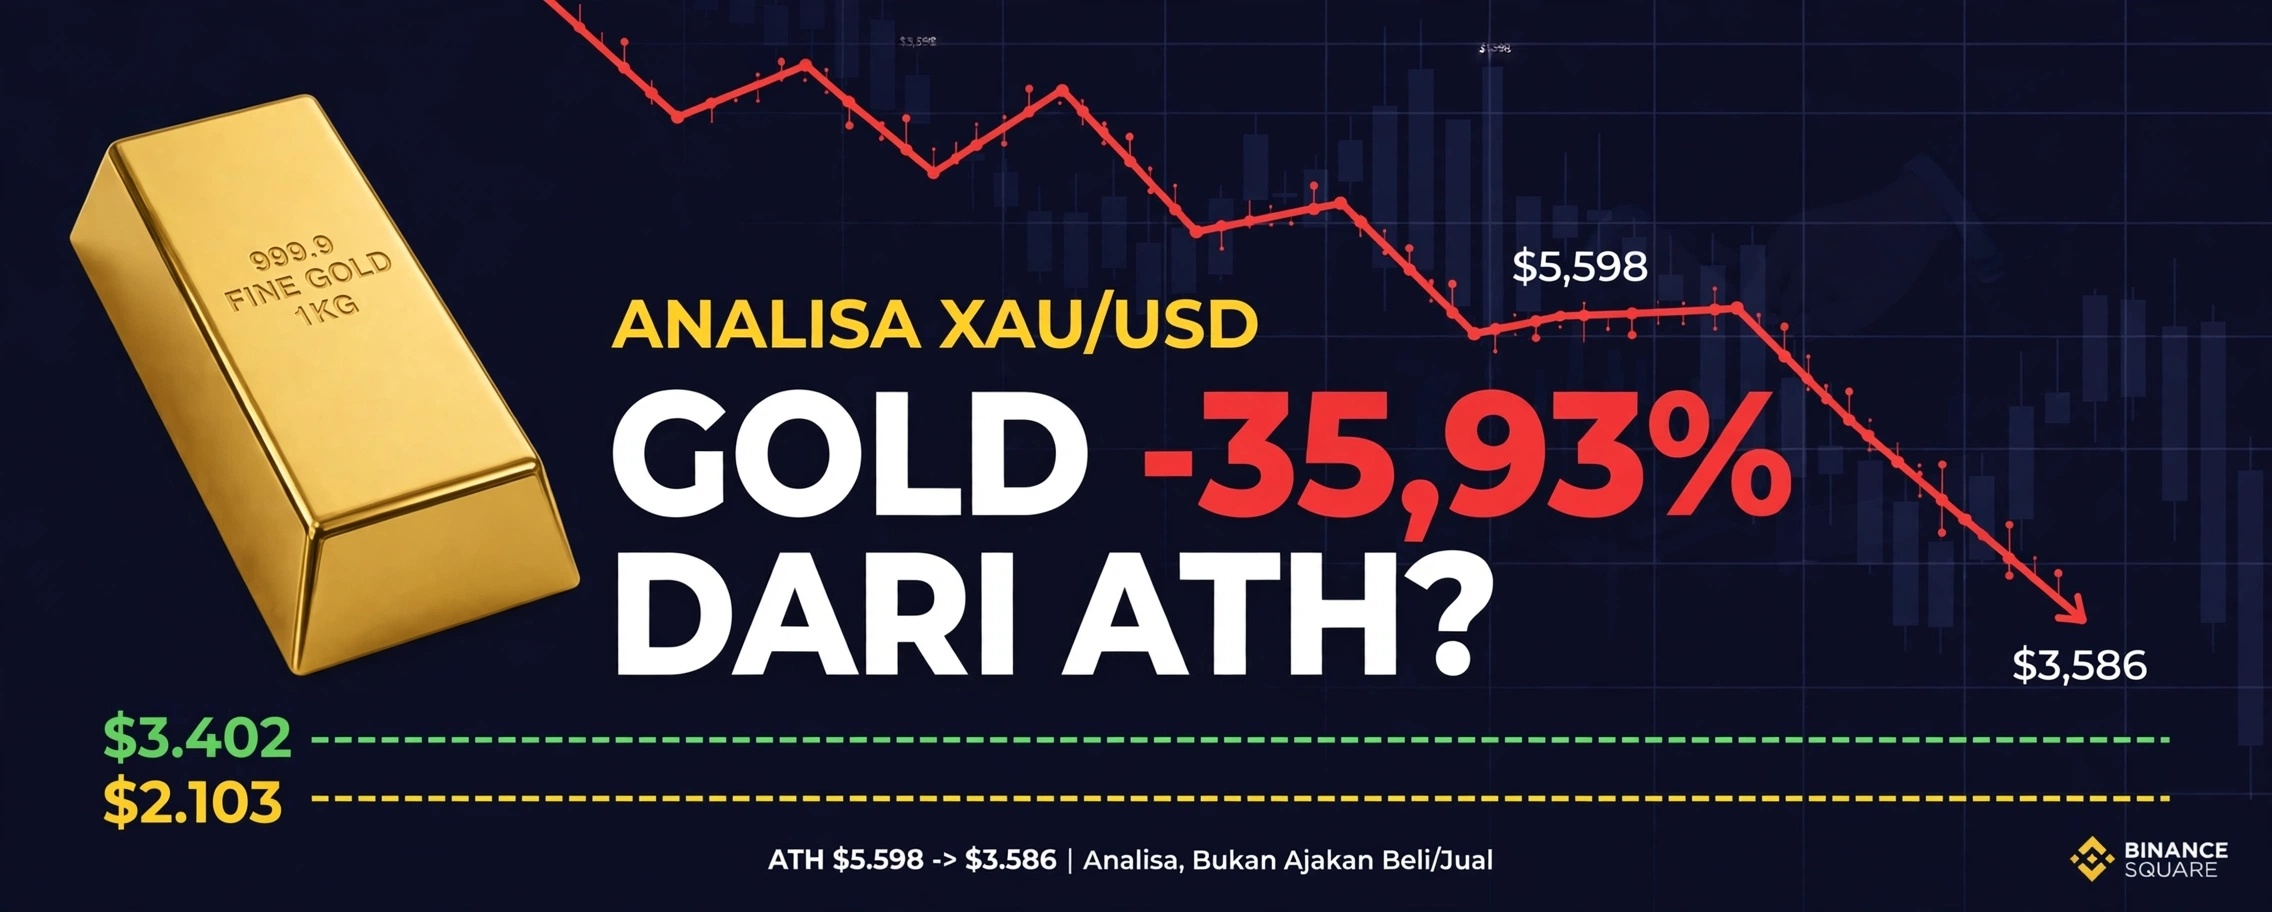

If you open the Gold (XAU/USD) chart on the weekly timeframe today, November 20, 2026, the picture is enough to leave many people wondering.
Current price: $3,586.69
ATH this year: $5,598
Decline: -$2,011.31 or -35.93%
This isn’t the usual small 5%–10% decline seen in Gold. The last time a decline of this magnitude occurred was during the 2011–2015 period, and it took years to unfold. Now, this move is happening in a matter of months.
Many are wondering: is this the euphoria phase starting to fade, or is it a discount phase?
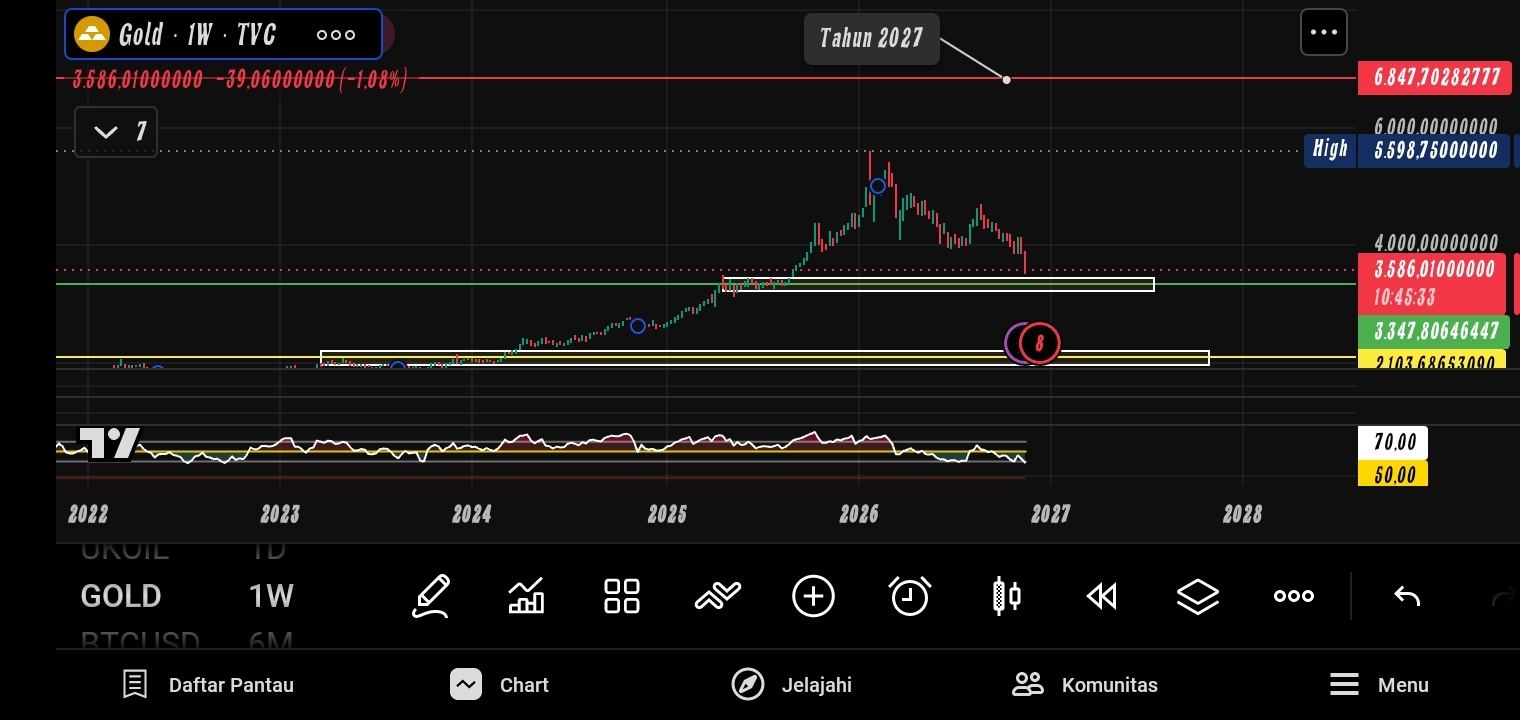
In this article, I'll break it down using data, not gut feeling. We'll start with the ATH, look at why the price has fallen this far, and then cover the 2 demand zones I've marked on the chart: green demand at $3.402 and yellow demand at $2.103.
1. FROM THE $5.598 ATH TO $3.586: THE DECLINE
Phase 1: Euphoria (Early 2024 - Mid-2026)
Gold rose quite steadily from its $2.103 base. It made a new ATH almost every month. Central banks seemed to be actively buying, retail investors started to FOMO, and the media talked every day about Gold reaching $6.000 and $7.000.
In this phase, Gold was no longer being discussed only by people who understood Gold. Almost everyone started talking about it. Historically, when everyone is talking about an asset, that phase is usually nearing its peak.
Phase 2: Quiet Distribution (Peak at $5.598)
At $5.598, the price made an ATH, but the candles were already starting to look weaker than before. Buying volume began to thin out, but the news still seemed entirely positive. This is often called the distribution phase. Smart money appeared to be slowly selling to retail investors who were still FOMOing.
On the Weekly chart, above $5.000, the candles were already getting smaller, with long wicks. That means buyers seemed to be tiring, while sellers were starting to enter.
Phase 3: Sharp Decline (From $5.598 to $3.586)
Once support at $5.000 was breached, the decline came quickly. Why? Because many people who bought at $5.000 - $5.598 were starting to feel the pressure. They began cutting losses all at once. Those using leverage could face margin calls and liquidation. Many spot buyers also sold in a panic.
From $5.598 to $3.586 is a drop of $2.011. And the decline wasn't a straight line. There were small bounces, but each bounce still seemed to form a new lower high. That means every attempt to buy the dip was still being overpowered by sellers.
As of today, November 20, 2026, the price is still at $3.586, and the latest Weekly candle is still red at -1,08%. The momentum indicator below the chart (RSI) is below 50. This means Weekly momentum still looks bearish. There are no strong signs of a reversal yet.
2. WHY HAS IT FALLEN THIS FAR? 5 FACTORS I'M WATCHING
Gold isn't falling on its own. There are 5 factors that appear to be stacking up at the same time:
Factor 1: Profit-Taking + Liquidity That Appears to Be Getting Sucked Into the Anthropic IPO
This is the factor most directly tied to what's happening now.
Yesterday, November 19, 2026, Anthropic held a $107,3 billion IPO. It was the largest IPO in history. Demand was recorded at $500 billion.
Investors have limited funds. When an IPO that large suddenly comes along, investors need to sell other assets to get cash to buy ANT. And what's easiest to sell after gaining so much? Gold, because it had already risen significantly from $2.103 to $5.598.
So Gold appears to be getting sold not because it's a bad asset, but because investors seem to need cash to buy Anthropic. Mohamed El-Erian calls this "making room." The market appears to be making room for AI.
The result: ANT rose 17% on its first day, but the Nasdaq fell -2%, Nvidia -3,4%, AMD -7,7%, and Gold also came under pressure. All the assets that had risen seemed to get sold.
Factor 2: Rising Real Yields & a Stronger Dollar
Interest rates are Gold's arch-enemy. When US real yields (bond yields minus inflation) rise, Gold becomes less attractive. Why hold Gold, which pays no interest, when holding Dollars / US bonds earns more interest?
During this Gold decline, real yields appear to be rising and the DXY is strengthening. Global investors seem to be moving from Gold to the Dollar. This is a fairly classic pattern.
Factor 3: Central Banks Begin to Slow Their Buying
From 2022 - 2024, central banks (especially China, India, and Turkey) appeared to be buying Gold quite aggressively. That helped Gold rise from $2.103 to $5.598. But once the price reached the $5.000 range, their buying pace seemed to slow. They didn't seem willing to buy at the top.
Once the biggest buyers started to ease off, the price immediately lost its main support.
Factor 4: Risk-On / Risk-Off Looks Backwards
Usually, when stocks fall, Gold rises because people run to safe havens. But this time, things look different.
When AI stocks fell (Nasdaq -2%), Gold fell too. Why? Because this doesn't look like a typical risk-off move; it looks more like a liquidity squeeze. Investors seem to need cash, so everything is being sold: stocks, crypto, and Gold.
The correlation data I've been tracking also shows this: the correlation between Spot Gold and total crypto market cap was 0.68 over 7 days and 0.78 over 30 days. That means Gold appears to be moving in the same direction as risk assets, not against them. This is not normal for Gold.
So it's no surprise that when BTC is in the red, Gold is too. They both seem to be getting sold to raise cash.
Factor 5: Overbought on the Weekly Chart
From $2.103 to $5.598, Gold rose +166,19% without any significant correction. Technically, it looks overbought on the Weekly and Monthly timeframes.
The market is like a rubber band. If you stretch it too far upward without a break, it tends to snap back down quite hard. This -35,93% drop looks like the market's way of "letting off steam" and returning to a more reasonable price.
So this decline doesn't look like Gold is broken. It looks like the previous rally was simply too steep.
3. CHART BREAKDOWN: 2 DEMAND ZONES I'M WATCHING
This is the most important part. On the Weekly chart, I've marked 2 zones. These aren't arbitrary lines; they're areas where large amounts of capital appear to have accumulated.
DEMAND 1: GREEN ZONE - $3.402 (Area I'm Watching for Trading)
The white box along the green line spans roughly $3.347 - $3.500, with $3.402 at its midpoint.
Why do I consider this area valid?
- In early 2025, the price consolidated here for quite a while, moving up and down within this box for months.
- After that, it broke out sharply to $5.598. So this is the breakout base.
- Since that breakout, the price has never returned to test this zone. So this would be the first retest.
First retests usually have the highest chance of a bounce, because buyers who missed out in 2025 have been waiting for the price to return here.
Current position: Price is $3.586, still 5,15% above the green zone. It hasn't touched it yet. So the move toward $3.983 hasn't played out. I'm still waiting for the price to fall to the $3.400 area first.
If this green zone holds, my target is clear:
From $3.402 to $3.983 is a gain of +17,08%. The $3.983 target isn't arbitrary; it's former support that has now become resistance around $4.000 (the red dashed line on the chart). So $3.983 is a logical TP 1 in my view.
In theory, if I enter at $3.402, place my SL below $3.300 (a risk of $102), and target $3.983 (a reward of $581), the RR would be 1 : 5,7 if the plan works. That's what makes this area interesting to watch.
But remember: if a Weekly candle closes below $3.347 (the lower boundary of the green box), I'll consider this plan invalidated. I won't force myself to hold.
DEMAND 2: YELLOW ZONE - $2.103 (Area I'm Watching for Long-Term Investing)
The yellow box below has a midpoint of $2.103, with the zone spanning roughly $1.980 - $2.200.
Why do I consider this the final demand zone?
- This is a 2-year base from 2022 - 2023. The price moved back and forth here for almost 2 years.
- It was tested repeatedly without breaking. Every time the price touched it, it bounced almost immediately.
- After breaking out in late 2023, the price soared to $5.598 and never returned. So this is still fresh demand that has never been retested.
If the price reaches this zone, that would mean Gold has fallen -41,37% from its current price and -62,43% from its ATH. That's a very deep decline.
But that's precisely why I consider it the best accumulation zone to watch over the long term. Not for scalping trades, but as a buying area to hold for 5-10 years.
I monitor this zone differently from the green one. I don't use a tight SL here. Instead, I use the DCA approach I'm watching:
- 30% of my allocation at $2.200 (top of the zone)
- 40% of my allocation at $2.103 (middle of the zone)
- 30% of my allocation at $1.980 (bottom of the zone, in case of a panic wick)
The average entry could end up around $2.090 - $2.100.
If the yellow zone breaks and a Weekly candle closes below $2.103, that's when I'll consider it a prolonged bear market. The next support I'll watch is at $1.800 - $1.600. But I consider that unlikely in the near term. It would take a very severe crisis for Gold to fall -62% from its ATH.
4. SO, WHERE IS GOLD HEADED NOW?
Here's a summary of 3 scenarios to make things clearer:
Scenario 1: Bounce From the Green Zone (Scenario I'm Watching for Trading)
The price falls to $3.350 - $3.420, holds, forms a rejection on the Daily/Weekly chart, and then could rise to $3.983.
The condition I'm watching: a Weekly candle must not close below $3.347.
This is a counter-trend scenario: trading against the Weekly downtrend to catch a bounce. It can work, but you have to be disciplined with your SL.
Scenario 2: Green Zone Breaks, Price Continues to Yellow
The price breaks below $3.347, then falls to $3.000, then $2.500, and eventually $2.103.
This is the scenario I'm watching if liquidity tightens further, the DXY strengthens, and the Anthropic + OpenAI IPOs continue to drain liquidity.
If this happens, I personally won't panic. That would actually be the long-term accumulation area I'm watching in the yellow zone.
Scenario 3: Extended Sideways Action (The Most Boring, but Most Common Scenario)
The price moves back and forth between $3.400 - $4.000 for months. It rises to $3.983, falls back to $3.400, rises again, then falls again.
This often happens after a major decline. The market needs time to build a new base before rising again.
CONCLUSION: WHAT'S MY APPROACH?
Gold falling -35,93% from its ATH isn't the end of the world. It looks like a reset phase after a +166% rally without a break.
What matters to me:
1. Personally, I'm still waiting. I haven't entered at $3.586 because the price is still in the middle, not in one of the demand areas I'm watching. I'm waiting for the price to enter the $3.400 green box.
2. I separate trading from investing. I'm watching the $3.402 green zone for trading, with an SL. I'm watching the $2.103 yellow zone for investing, using a DCA approach rather than a tight SL.
3. I'm keeping an eye on Anthropic's upcoming quarterly reports. If Anthropic can prove that AI is profitable, liquidity could return to the market, potentially lifting Gold and crypto too. If Anthropic disappoints, I'm watching for the possibility that all risk-on assets + Gold could fall further.
4. I'm trying not to FOMO. History shows that after a major decline, prices usually don't immediately make a V-shaped recovery back to their ATH. They usually form a base for months first.
What do you think? Could Gold bounce from $3.402 and return to $3.983, or could it break down further to $2.103? Comment below; I'd love to hear your thoughts.
This is not a recommendation to buy or sell. This is educational content. DYOR before making any decisions. Everything I've written here is my personal opinion and analysis.
#GOLD #XAUUSD #Anthropic #ANT #BTC #Crypto #Trading #Investing