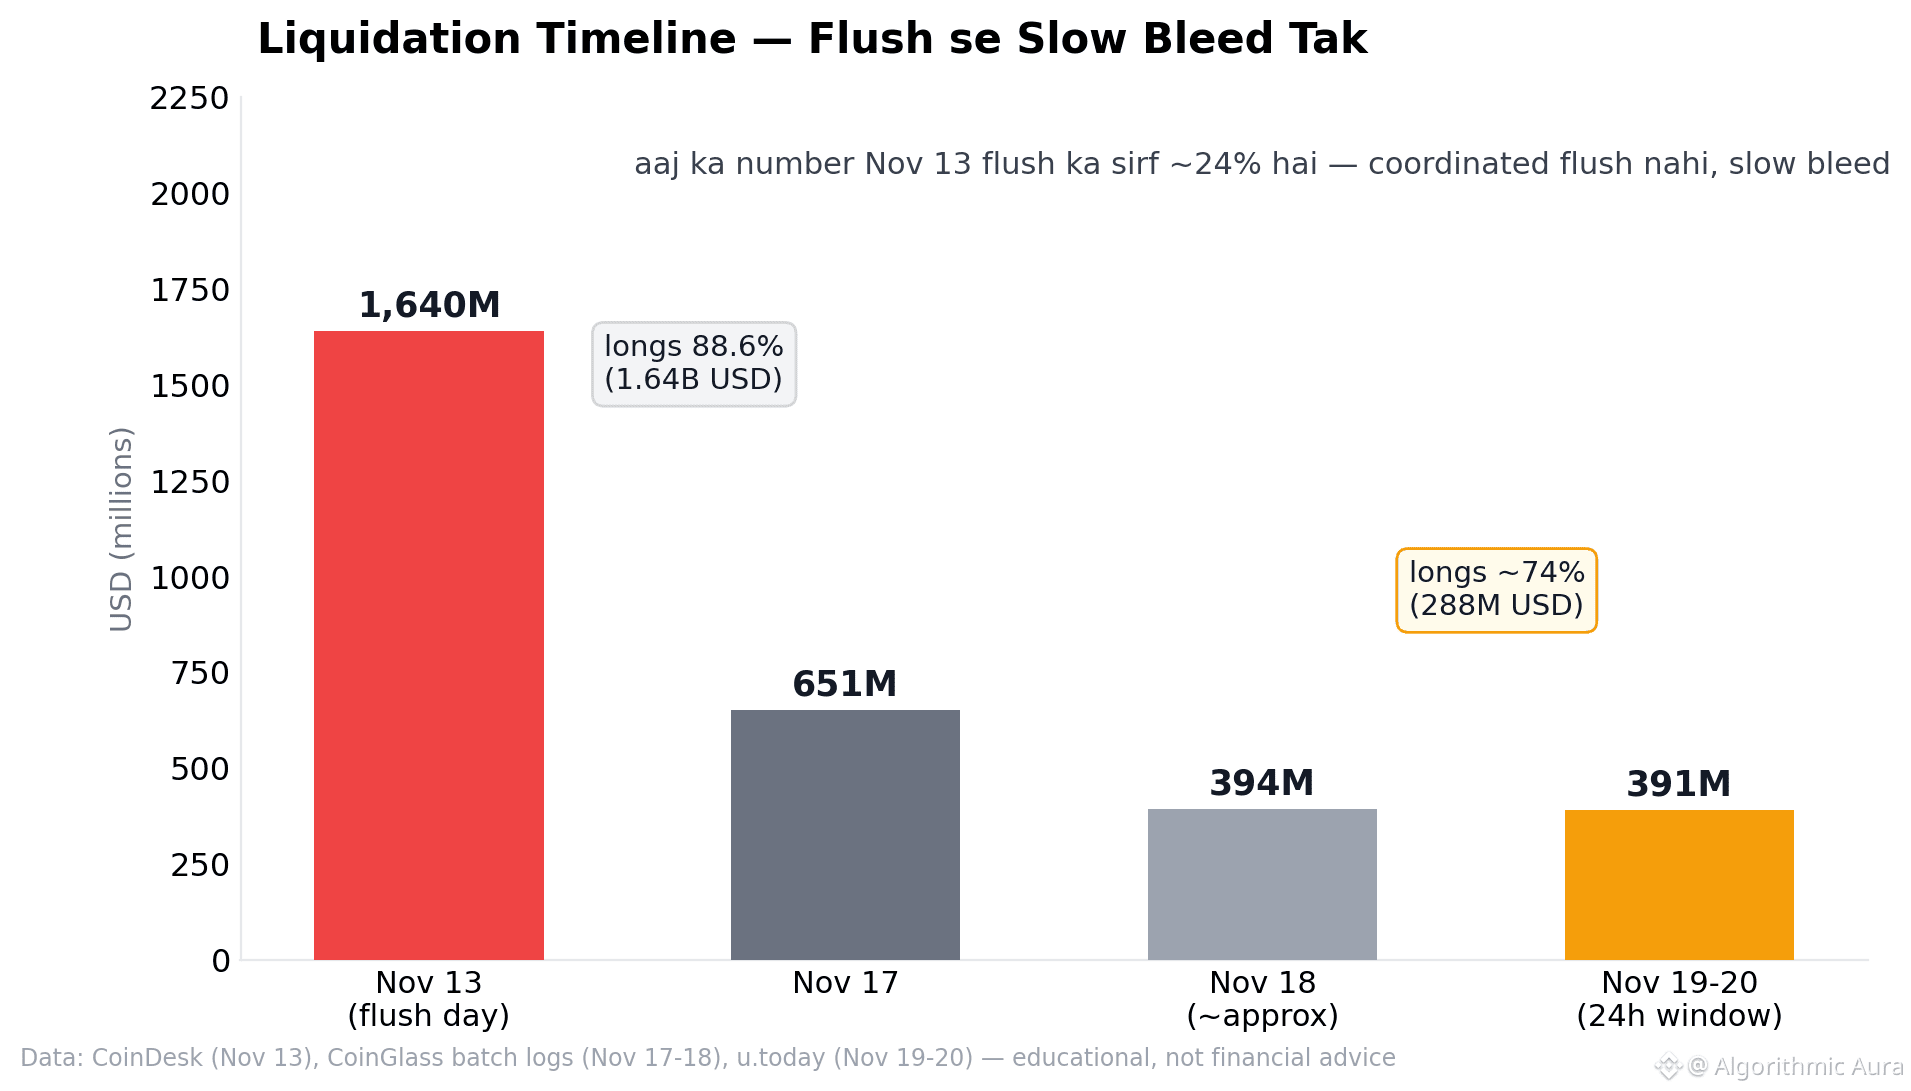
📊 One chart: from flush to slow bleed — liquidation timeline.
📉 1) Nov 13: 1,640M USD in one day — longs 88.6%. The biggest day of the month.
2) Nov 17: 651M → Nov 18: ~394M (approx.) → today's window: 391M.
3) The trend is down, but the side is the same: longs account for the larger share every day — ~74% today.
🧊 Flush days are about psychology as well as data — recovery is slow from there.
⚠️ Watch the chart and keep track of your leverage.
$BTC
#Bitcoin #Liquidation #CryptoCharts
📉 1) Nov 13: 1,640M USD in one day — longs 88.6%. The biggest day of the month.
2) Nov 17: 651M → Nov 18: ~394M (approx.) → today's window: 391M.
3) The trend is down, but the side is the same: longs account for the larger share every day — ~74% today.
🧊 Flush days are about psychology as well as data — recovery is slow from there.
⚠️ Watch the chart and keep track of your leverage.
$BTC
#Bitcoin #Liquidation #CryptoCharts