
F I N K Y
15.2k Posts

F I N K Y
 Square Verified+
Report
Block User
Building wealth, one sat at a time | Sharing my crypto journey...
Open Trade
Frequent Trader
1.4 Years
30 Following
39.4K+ Followers
38.7K+ Liked
Posts
Portfolio
All
Live
·
--
Bullish
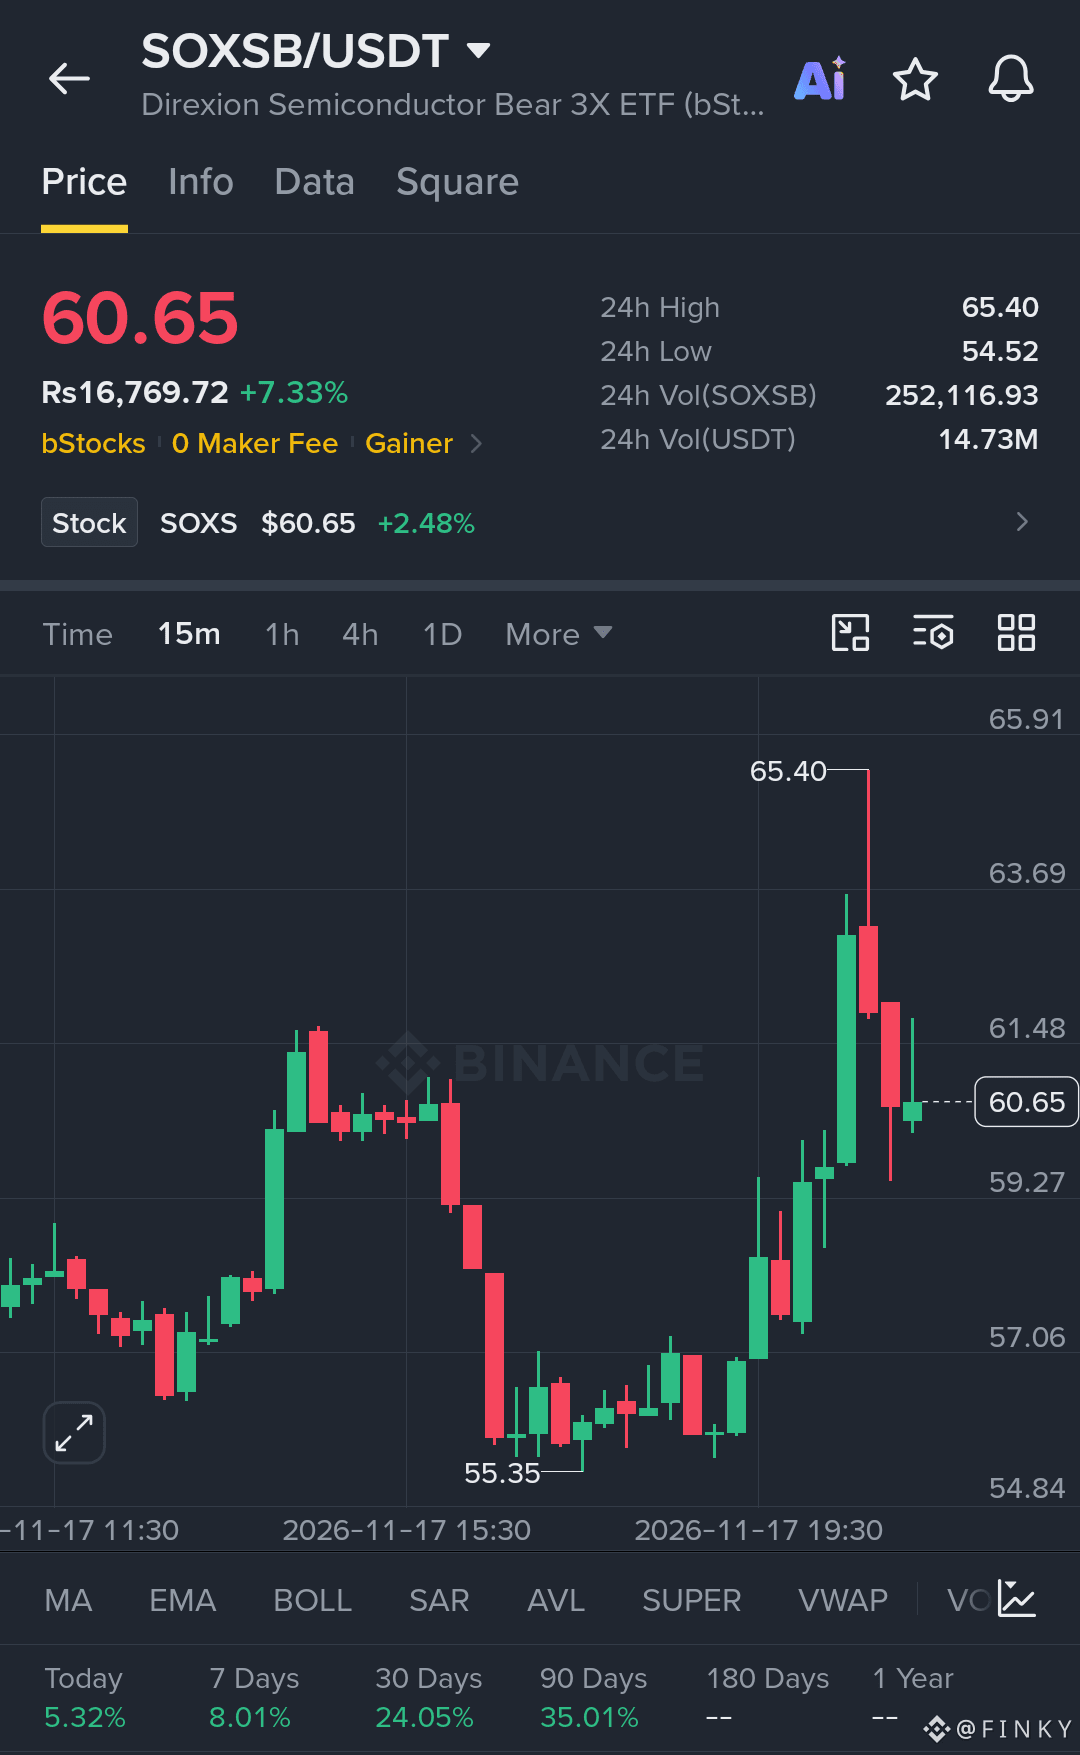
$SOXSB is making a strong comeback, and the latest price action is getting interesting.
Trading around $60.65, up 7.33%, SOXSB has recovered sharply from the $55.35 low and pushed all the way to a 24-hour high of $65.40.
But the rally has met selling pressure near the top, and price is now pulling back. This is the level where I want to see how strong the buyers really are.
Here are the key levels on my chart:
$59.27 is the first support to watch. Holding above this area could give buyers another chance to push toward $61.48.
If momentum returns and price reclaims $61.48, the next upside levels are $63.69 and $65.40.
On the other hand, losing $59.27 could bring $57.06 into focus, with stronger downside support near $55.35.
The 15-minute structure still shows a strong recovery, but the rejection from $65.40 tells me not to chase the move blindly.
I want to see buyers defend support and reclaim resistance before calling another breakout.
Can SOXSB recover toward $65.40, or is this pullback about to get deeper?
Stay patient, manage your risk, and never let one trade control your capital.
{spot}(SOXSBUSDT)
#NvidiaBoardNotConsideringHuang’sReturnasCEO
$SOXSB is making a strong comeback, and the latest price action is getting interesting.
Trading around $60.65, up 7.33%, SOXSB has recovered sharply from the $55.35 low and pushed all the way to a 24-hour high of $65.40.
But the rally has met selling pressure near the top, and price is now pulling back. This is the level where I want to see how strong the buyers really are.
Here are the key levels on my chart:
$59.27 is the first support to watch. Holding above this area could give buyers another chance to push toward $61.48.
If momentum returns and price reclaims $61.48, the next upside levels are $63.69 and $65.40.
On the other hand, losing $59.27 could bring $57.06 into focus, with stronger downside support near $55.35.
The 15-minute structure still shows a strong recovery, but the rejection from $65.40 tells me not to chase the move blindly.
I want to see buyers defend support and reclaim resistance before calling another breakout.
Can SOXSB recover toward $65.40, or is this pullback about to get deeper?
Stay patient, manage your risk, and never let one trade control your capital.
#NvidiaBoardNotConsideringHuang’sReturnasCEO
Trading around $60.65, up 7.33%, SOXSB has recovered sharply from the $55.35 low and pushed all the way to a 24-hour high of $65.40.
But the rally has met selling pressure near the top, and price is now pulling back. This is the level where I want to see how strong the buyers really are.
Here are the key levels on my chart:
$59.27 is the first support to watch. Holding above this area could give buyers another chance to push toward $61.48.
If momentum returns and price reclaims $61.48, the next upside levels are $63.69 and $65.40.
On the other hand, losing $59.27 could bring $57.06 into focus, with stronger downside support near $55.35.
The 15-minute structure still shows a strong recovery, but the rejection from $65.40 tells me not to chase the move blindly.
I want to see buyers defend support and reclaim resistance before calling another breakout.
Can SOXSB recover toward $65.40, or is this pullback about to get deeper?
Stay patient, manage your risk, and never let one trade control your capital.
#NvidiaBoardNotConsideringHuang’sReturnasCEO
19
·
--
Bullish
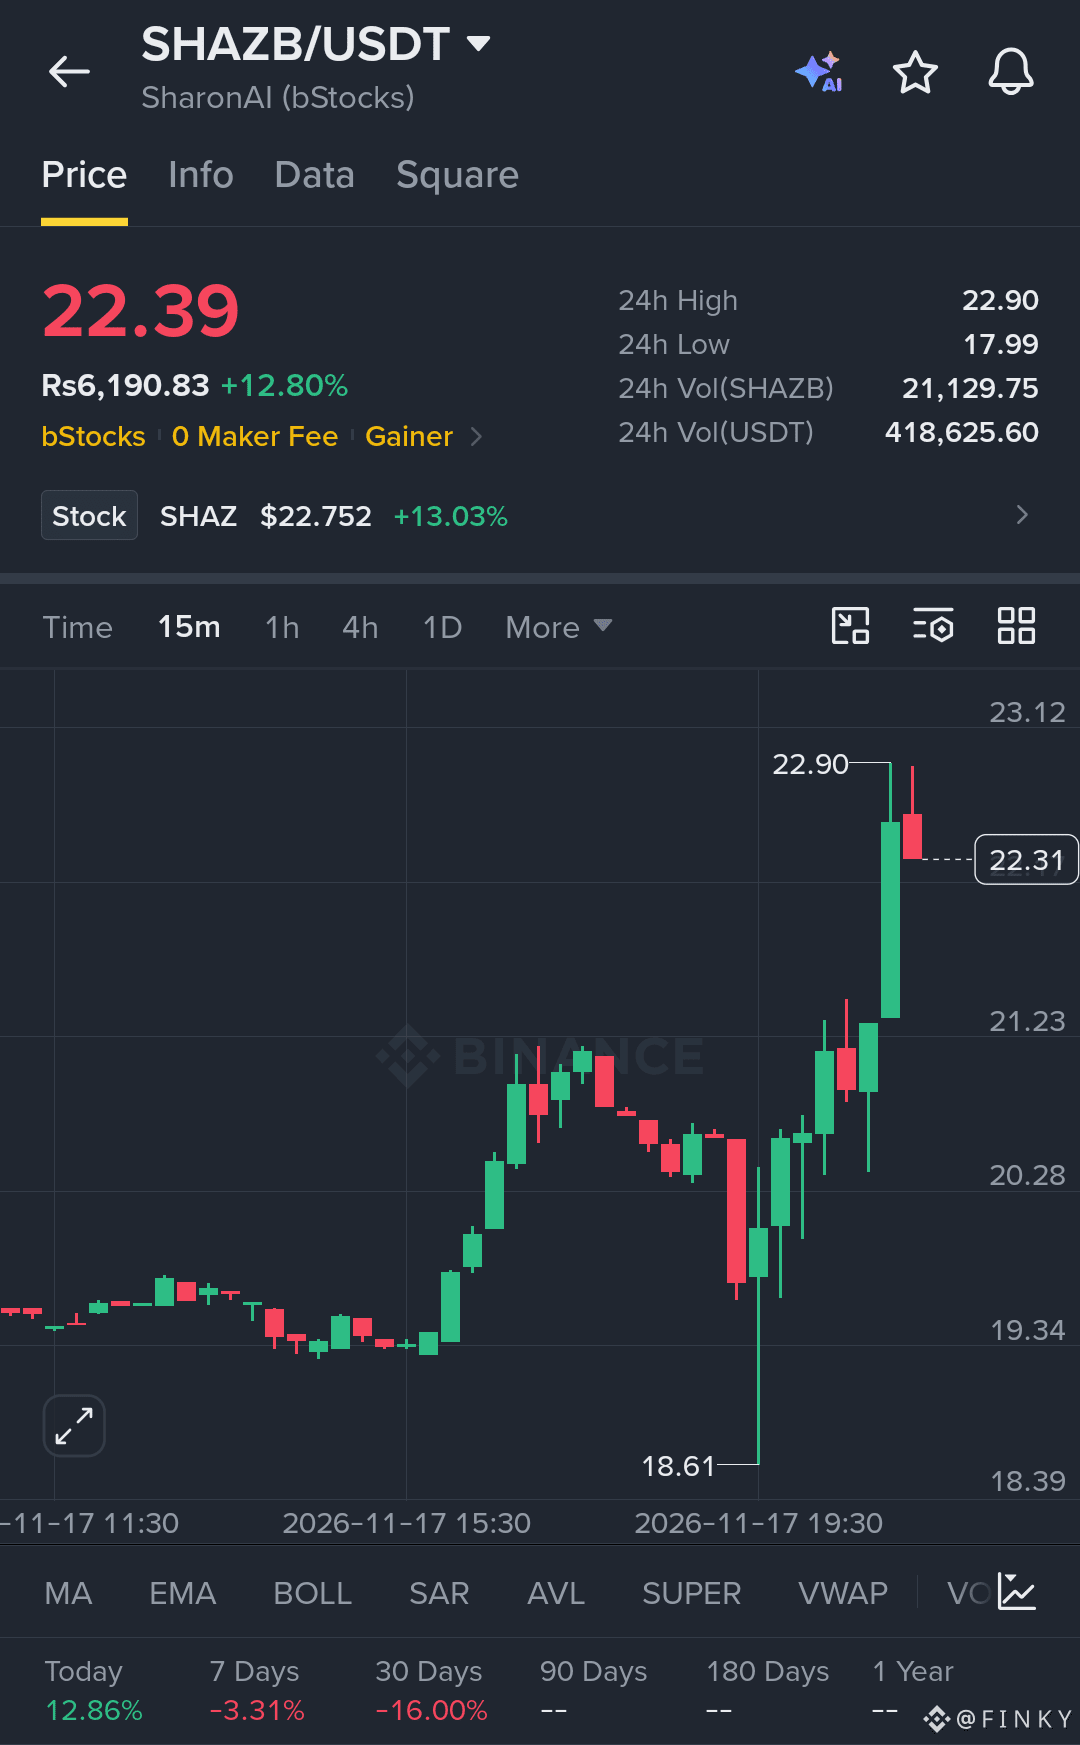
$SHAZB is showing strong bullish momentum, and buyers are pushing price toward a fresh 24-hour high.
SHAZB is trading around $22.39, up 12.80%, after recovering strongly from the $18.61 low. The most interesting part is how quickly buyers stepped in after that sharp dip.
Price has now climbed above the previous trading range and reached $22.90, showing strong buying interest. But after such a fast move, a short pullback would not be surprising.
Here are the levels I'm watching closely.
$22.00–$21.23 is the first area I'd watch for support. If buyers defend this zone, another attempt toward $22.90 could follow.
A clean breakout above $22.90 would strengthen the bullish structure and could open the way toward $23.12.
On the downside, losing $21.23 would weaken the current setup and bring $20.28 into focus.
The 15-minute chart looks bullish, but I don't want to confuse a strong green candle with guaranteed continuation. The next move needs confirmation.
I'm watching whether buyers can hold their ground above $22.00 and turn the recent breakout into lasting support.
Will SHAZB break above $22.90 and continue higher, or are buyers running out of steam?
No chasing. Wait for confirmation, protect your capital, and let the market show its hand.
{spot}(SHAZBUSDT)
#AnthropicIPOTestsInvestorAppetiteForAI
$SHAZB is showing strong bullish momentum, and buyers are pushing price toward a fresh 24-hour high.
SHAZB is trading around $22.39, up 12.80%, after recovering strongly from the $18.61 low. The most interesting part is how quickly buyers stepped in after that sharp dip.
Price has now climbed above the previous trading range and reached $22.90, showing strong buying interest. But after such a fast move, a short pullback would not be surprising.
Here are the levels I'm watching closely.
$22.00–$21.23 is the first area I'd watch for support. If buyers defend this zone, another attempt toward $22.90 could follow.
A clean breakout above $22.90 would strengthen the bullish structure and could open the way toward $23.12.
On the downside, losing $21.23 would weaken the current setup and bring $20.28 into focus.
The 15-minute chart looks bullish, but I don't want to confuse a strong green candle with guaranteed continuation. The next move needs confirmation.
I'm watching whether buyers can hold their ground above $22.00 and turn the recent breakout into lasting support.
Will SHAZB break above $22.90 and continue higher, or are buyers running out of steam?
No chasing. Wait for confirmation, protect your capital, and let the market show its hand.
#AnthropicIPOTestsInvestorAppetiteForAI
SHAZB is trading around $22.39, up 12.80%, after recovering strongly from the $18.61 low. The most interesting part is how quickly buyers stepped in after that sharp dip.
Price has now climbed above the previous trading range and reached $22.90, showing strong buying interest. But after such a fast move, a short pullback would not be surprising.
Here are the levels I'm watching closely.
$22.00–$21.23 is the first area I'd watch for support. If buyers defend this zone, another attempt toward $22.90 could follow.
A clean breakout above $22.90 would strengthen the bullish structure and could open the way toward $23.12.
On the downside, losing $21.23 would weaken the current setup and bring $20.28 into focus.
The 15-minute chart looks bullish, but I don't want to confuse a strong green candle with guaranteed continuation. The next move needs confirmation.
I'm watching whether buyers can hold their ground above $22.00 and turn the recent breakout into lasting support.
Will SHAZB break above $22.90 and continue higher, or are buyers running out of steam?
No chasing. Wait for confirmation, protect your capital, and let the market show its hand.
#AnthropicIPOTestsInvestorAppetiteForAI
17
·
--
Bullish
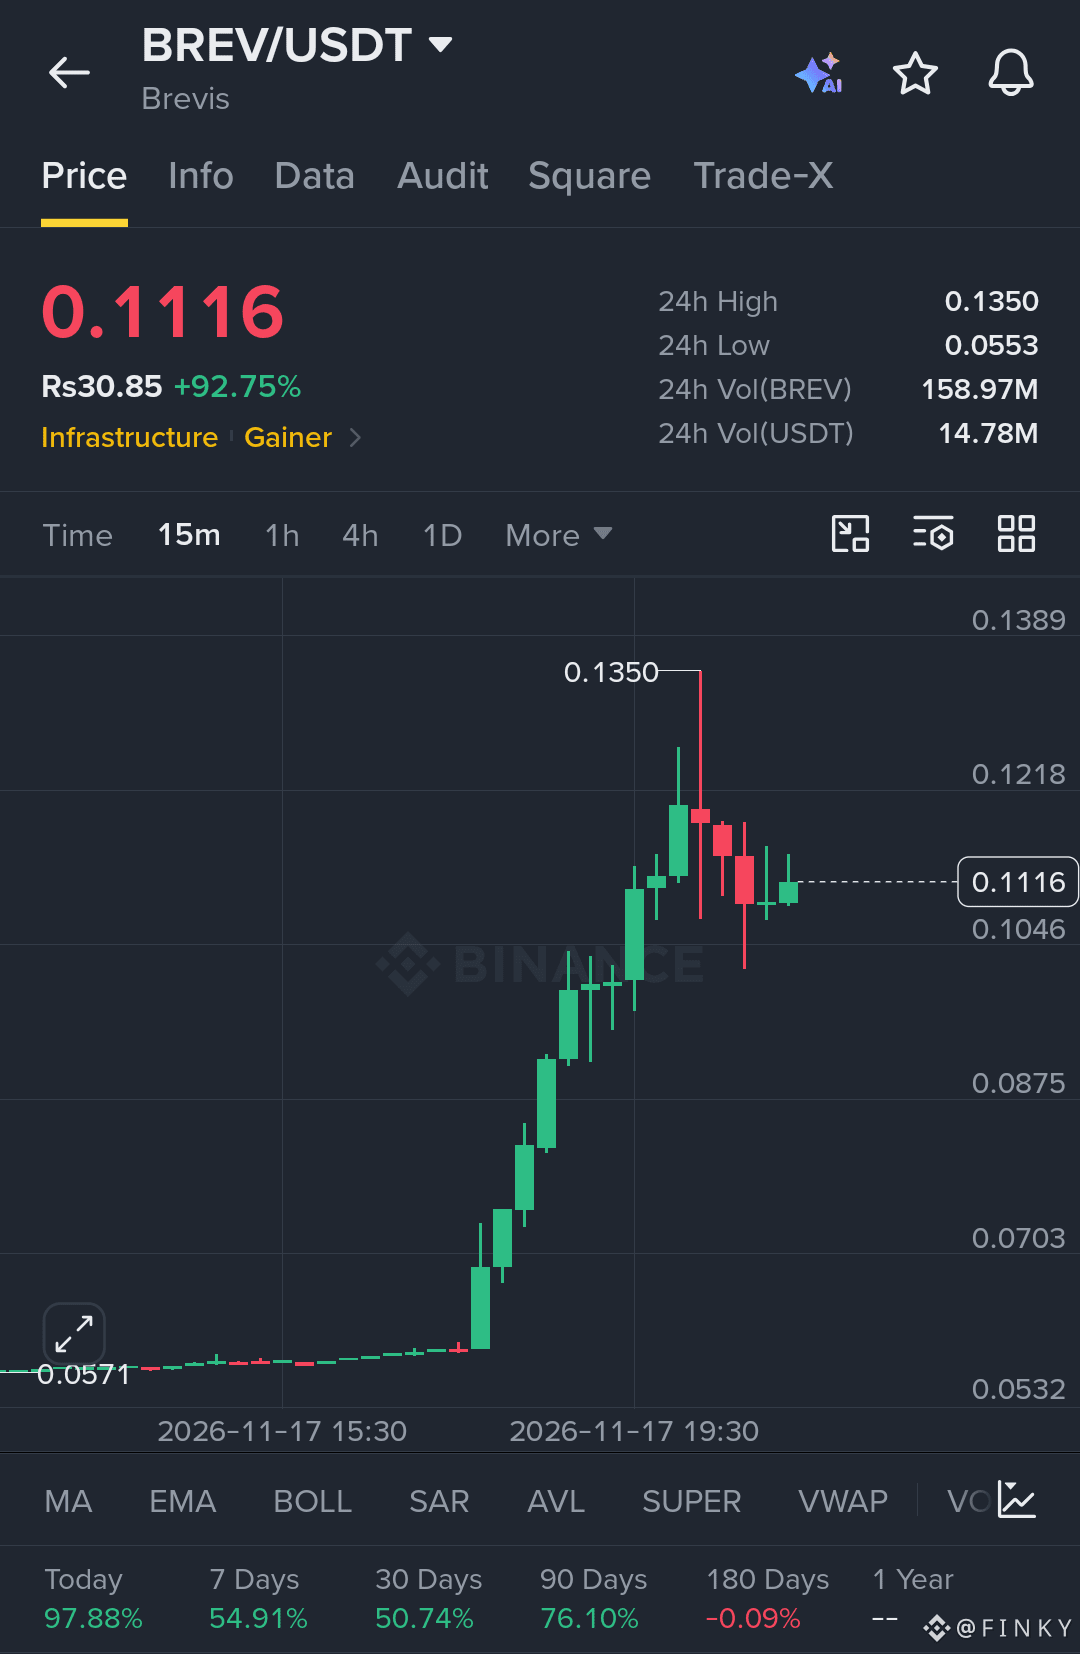
$BREV is making a serious move, but the next few candles could decide everything.
$BREV is trading around $0.1116, up 92.75%, after an explosive rally from the $0.0571 area. Buyers have clearly stepped in with strength, pushing the price as high as $0.1350 within 24 hours.
But here is what matters now.
After that massive pump, BREV faced rejection near $0.1350 and entered a short-term pullback. Price is now trying to stabilize around $0.1116.
I'm watching two important levels:
$0.1046 is the first support to defend. If buyers hold this area, another attempt toward $0.1218 becomes possible.
A clean breakout above $0.1218 could open the door for a retest of $0.1350. If momentum returns, a move toward $0.1389 could come into focus.
However, losing $0.1046 would weaken the setup and could expose the $0.0875 area.
The bigger picture is still interesting. BREV has already delivered a huge move, but chasing after a rally like this is risky. I want to see buyers defend support and confirm strength before considering the next leg.
The real question is simple: Is BREV preparing for another breakout, or will sellers take control after this massive pump?
Keep your risk under control. Cash is also a position.
{spot}(BREVUSDT)
#NvidiaEarningsTonight:AIStocks’NextMove?
$BREV is making a serious move, but the next few candles could decide everything.
$BREV is trading around $0.1116, up 92.75%, after an explosive rally from the $0.0571 area. Buyers have clearly stepped in with strength, pushing the price as high as $0.1350 within 24 hours.
But here is what matters now.
After that massive pump, BREV faced rejection near $0.1350 and entered a short-term pullback. Price is now trying to stabilize around $0.1116.
I'm watching two important levels:
$0.1046 is the first support to defend. If buyers hold this area, another attempt toward $0.1218 becomes possible.
A clean breakout above $0.1218 could open the door for a retest of $0.1350. If momentum returns, a move toward $0.1389 could come into focus.
However, losing $0.1046 would weaken the setup and could expose the $0.0875 area.
The bigger picture is still interesting. BREV has already delivered a huge move, but chasing after a rally like this is risky. I want to see buyers defend support and confirm strength before considering the next leg.
The real question is simple: Is BREV preparing for another breakout, or will sellers take control after this massive pump?
Keep your risk under control. Cash is also a position.
#NvidiaEarningsTonight:AIStocks’NextMove?
$BREV is trading around $0.1116, up 92.75%, after an explosive rally from the $0.0571 area. Buyers have clearly stepped in with strength, pushing the price as high as $0.1350 within 24 hours.
But here is what matters now.
After that massive pump, BREV faced rejection near $0.1350 and entered a short-term pullback. Price is now trying to stabilize around $0.1116.
I'm watching two important levels:
$0.1046 is the first support to defend. If buyers hold this area, another attempt toward $0.1218 becomes possible.
A clean breakout above $0.1218 could open the door for a retest of $0.1350. If momentum returns, a move toward $0.1389 could come into focus.
However, losing $0.1046 would weaken the setup and could expose the $0.0875 area.
The bigger picture is still interesting. BREV has already delivered a huge move, but chasing after a rally like this is risky. I want to see buyers defend support and confirm strength before considering the next leg.
The real question is simple: Is BREV preparing for another breakout, or will sellers take control after this massive pump?
Keep your risk under control. Cash is also a position.
#NvidiaEarningsTonight:AIStocks’NextMove?
394
·
--
Article
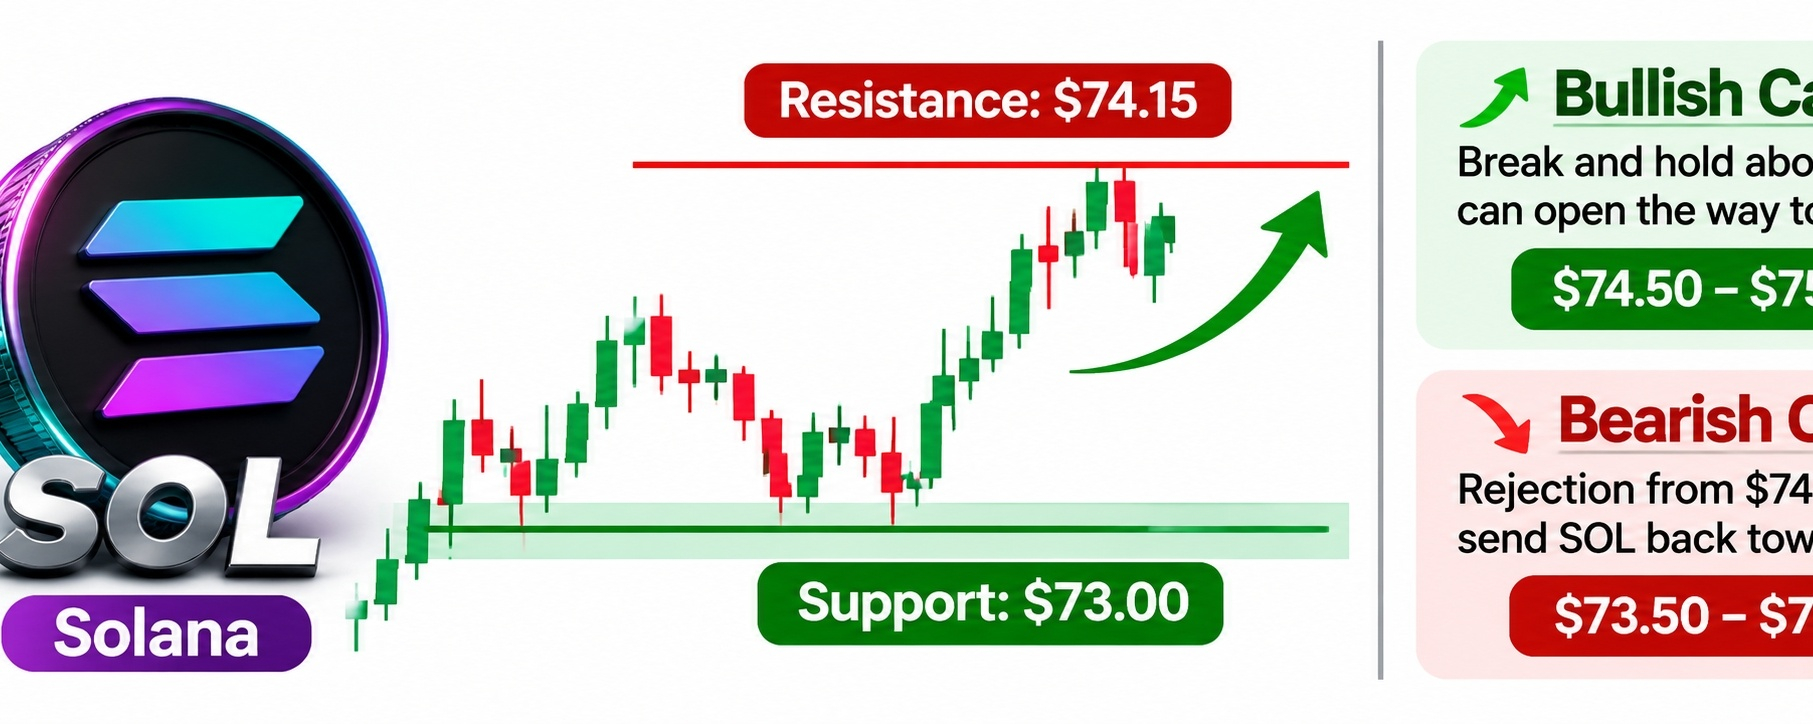
SOL's Comeback Is Taking Shape, but $74.15 Could Change EverythingSolana ($SOL ) is showing signs of a comeback, and buyers are starting to make their presence felt. After spending hours struggling around the $72.20–$73.00 range, SOL has pushed higher and is now trading near $73.85, up 4.54% in the last 24 hours.
What makes this move interesting is how buyers stepped in after several attempts to push the price lower. Instead of allowing another breakdown, they drove SOL above $73.00 and brought it close to the $74.15 intraday high. That's a positive change in short-term momentum.
But I don't think the job is finished yet.
The $74.00–$74.15 area is where SOL needs to prove its strength. Sellers have already reacted around this zone, so a clean breakout followed by a successful retest would be a much stronger signal than a quick price spike.
If buyers manage to hold above $73.50 and break $74.15, the next areas I would watch are $74.50 and $75.00. A move toward those levels could bring fresh confidence into the market.
On the other hand, failure to break resistance could send SOL back toward $73.50 and $73.00. Losing $73.00 would make the current recovery less convincing and could bring the $72.40–$72.20 area back into focus.
There is another detail worth watching. Despite today's recovery, SOL is still down 14.68% over seven days and 28.91% over 30 days. So, one strong session does not erase the weakness seen over the past month. Buyers still have work to do before calling this a bigger trend reversal.
$LAB
Personally, I would rather wait for confirmation than chase the price near resistance. A strong breakout, a healthy retest, and buyers defending higher levels would make the setup more interesting. If that confirmation doesn't come, staying out is also a decision.
The market has given SOL some breathing room, but now it needs to show whether this buying pressure is strong enough to continue.
Can SOL break $74.15 and make a run toward $75, or will sellers step in once again?
#GoldmanSachsReports$1.22BInEtherETFHoldings #AnthropicIPOTestsInvestorAppetiteForAI #NvidiaBoardNotConsideringHuang’sReturnasCEO #NvidiaEarningsTonight:AIStocks’NextMove?
SOL's Comeback Is Taking Shape, but $74.15 Could Change Everything
Solana ($SOL ) is showing signs of a comeback, and buyers are starting to make their presence felt. After spending hours struggling around the $72.20–$73.00 range, SOL has pushed higher and is now trading near $73.85, up 4.54% in the last 24 hours.
What makes this move interesting is how buyers stepped in after several attempts to push the price lower. Instead of allowing another breakdown, they drove SOL above $73.00 and brought it close to the $74.15 intraday high. That's a positive change in short-term momentum.
But I don't think the job is finished yet.
The $74.00–$74.15 area is where SOL needs to prove its strength. Sellers have already reacted around this zone, so a clean breakout followed by a successful retest would be a much stronger signal than a quick price spike.
If buyers manage to hold above $73.50 and break $74.15, the next areas I would watch are $74.50 and $75.00. A move toward those levels could bring fresh confidence into the market.
On the other hand, failure to break resistance could send SOL back toward $73.50 and $73.00. Losing $73.00 would make the current recovery less convincing and could bring the $72.40–$72.20 area back into focus.
There is another detail worth watching. Despite today's recovery, SOL is still down 14.68% over seven days and 28.91% over 30 days. So, one strong session does not erase the weakness seen over the past month. Buyers still have work to do before calling this a bigger trend reversal.
$LAB
Personally, I would rather wait for confirmation than chase the price near resistance. A strong breakout, a healthy retest, and buyers defending higher levels would make the setup more interesting. If that confirmation doesn't come, staying out is also a decision.
The market has given SOL some breathing room, but now it needs to show whether this buying pressure is strong enough to continue.
Can SOL break $74.15 and make a run toward $75, or will sellers step in once again?
#GoldmanSachsReports$1.22BInEtherETFHoldings #AnthropicIPOTestsInvestorAppetiteForAI #NvidiaBoardNotConsideringHuang’sReturnasCEO #NvidiaEarningsTonight:AIStocks’NextMove?
What makes this move interesting is how buyers stepped in after several attempts to push the price lower. Instead of allowing another breakdown, they drove SOL above $73.00 and brought it close to the $74.15 intraday high. That's a positive change in short-term momentum.
But I don't think the job is finished yet.
The $74.00–$74.15 area is where SOL needs to prove its strength. Sellers have already reacted around this zone, so a clean breakout followed by a successful retest would be a much stronger signal than a quick price spike.
If buyers manage to hold above $73.50 and break $74.15, the next areas I would watch are $74.50 and $75.00. A move toward those levels could bring fresh confidence into the market.
On the other hand, failure to break resistance could send SOL back toward $73.50 and $73.00. Losing $73.00 would make the current recovery less convincing and could bring the $72.40–$72.20 area back into focus.
There is another detail worth watching. Despite today's recovery, SOL is still down 14.68% over seven days and 28.91% over 30 days. So, one strong session does not erase the weakness seen over the past month. Buyers still have work to do before calling this a bigger trend reversal.
$LAB
Personally, I would rather wait for confirmation than chase the price near resistance. A strong breakout, a healthy retest, and buyers defending higher levels would make the setup more interesting. If that confirmation doesn't come, staying out is also a decision.
The market has given SOL some breathing room, but now it needs to show whether this buying pressure is strong enough to continue.
Can SOL break $74.15 and make a run toward $75, or will sellers step in once again?
#GoldmanSachsReports$1.22BInEtherETFHoldings #AnthropicIPOTestsInvestorAppetiteForAI #NvidiaBoardNotConsideringHuang’sReturnasCEO #NvidiaEarningsTonight:AIStocks’NextMove?
1
187
·
--
Bullish
$BTC IS FIGHTING BACK! Buyers Have Stepped In, But One Important Resistance Still Stands in Their Way.
Bitcoin is trading around $65,085, showing a strong recovery after dropping to $64,079 on the 15-minute chart.
What caught my attention is the sharp buying pressure from the lows. BTC pushed aggressively higher, reclaimed the $64,750 area, and continued climbing toward $65,184.
Now the real test begins.
Key Levels to Watch:
- Current Price: $65,085
- Immediate Resistance: $65,184
- Next Resistance: $65,239
- First Support: $64,996
- Stronger Support: $64,753
- Major Short-Term Support: $64,510
- Recent Swing Low: $64,079
Bullish Scenario:
If buyers defend $64,996 and push BTC above $65,184, we could see another attempt toward $65,239 and potentially higher levels.
Bearish Scenario:
If BTC gets rejected around $65,184 and loses $64,996, the recovery could lose strength. A move toward $64,753 and $64,510 would then become important to watch.
But let's not ignore the bigger picture.
BTC is still down 12.87% over seven days and 20.15% over 30 days. This short-term bounce is encouraging, but it does not confirm a full trend reversal yet.
The 24-hour trading volume stands at 26,404 BTC, with approximately $1.71 billion in USDT volume.
My view: Buyers have finally shown some strength, but the next move depends on whether they can turn resistance into support.
No chasing green candles. Let the market confirm its direction first.
Will Bitcoin break $65,184 and continue its recovery, or are sellers preparing another rejection?
{spot}(BTCUSDT)
$ETH
{spot}(ETHUSDT)
$BNB
{spot}(BNBUSDT)
#NvidiaEarningsTonight:AIStocks’NextMove?
$BTC IS FIGHTING BACK! Buyers Have Stepped In, But One Important Resistance Still Stands in Their Way.
Bitcoin is trading around $65,085, showing a strong recovery after dropping to $64,079 on the 15-minute chart.
What caught my attention is the sharp buying pressure from the lows. BTC pushed aggressively higher, reclaimed the $64,750 area, and continued climbing toward $65,184.
Now the real test begins.
Key Levels to Watch:
- Current Price: $65,085
- Immediate Resistance: $65,184
- Next Resistance: $65,239
- First Support: $64,996
- Stronger Support: $64,753
- Major Short-Term Support: $64,510
- Recent Swing Low: $64,079
Bullish Scenario:
If buyers defend $64,996 and push BTC above $65,184, we could see another attempt toward $65,239 and potentially higher levels.
Bearish Scenario:
If BTC gets rejected around $65,184 and loses $64,996, the recovery could lose strength. A move toward $64,753 and $64,510 would then become important to watch.
But let's not ignore the bigger picture.
BTC is still down 12.87% over seven days and 20.15% over 30 days. This short-term bounce is encouraging, but it does not confirm a full trend reversal yet.
The 24-hour trading volume stands at 26,404 BTC, with approximately $1.71 billion in USDT volume.
My view: Buyers have finally shown some strength, but the next move depends on whether they can turn resistance into support.
No chasing green candles. Let the market confirm its direction first.
Will Bitcoin break $65,184 and continue its recovery, or are sellers preparing another rejection?
$ETH
$BNB
#NvidiaEarningsTonight:AIStocks’NextMove?
Bitcoin is trading around $65,085, showing a strong recovery after dropping to $64,079 on the 15-minute chart.
What caught my attention is the sharp buying pressure from the lows. BTC pushed aggressively higher, reclaimed the $64,750 area, and continued climbing toward $65,184.
Now the real test begins.
Key Levels to Watch:
- Current Price: $65,085
- Immediate Resistance: $65,184
- Next Resistance: $65,239
- First Support: $64,996
- Stronger Support: $64,753
- Major Short-Term Support: $64,510
- Recent Swing Low: $64,079
Bullish Scenario:
If buyers defend $64,996 and push BTC above $65,184, we could see another attempt toward $65,239 and potentially higher levels.
Bearish Scenario:
If BTC gets rejected around $65,184 and loses $64,996, the recovery could lose strength. A move toward $64,753 and $64,510 would then become important to watch.
But let's not ignore the bigger picture.
BTC is still down 12.87% over seven days and 20.15% over 30 days. This short-term bounce is encouraging, but it does not confirm a full trend reversal yet.
The 24-hour trading volume stands at 26,404 BTC, with approximately $1.71 billion in USDT volume.
My view: Buyers have finally shown some strength, but the next move depends on whether they can turn resistance into support.
No chasing green candles. Let the market confirm its direction first.
Will Bitcoin break $65,184 and continue its recovery, or are sellers preparing another rejection?
$ETH
$BNB
#NvidiaEarningsTonight:AIStocks’NextMove?


2
125
·
--
Bullish
🚨 NVIDIA’s Leadership Shakeup Is Putting the AI Market on Alert.
A petition with over 180K signatures, support from Elon Musk, and positive remarks from Donald Trump still haven't changed the situation. Nvidia’s board reportedly has no plans to bring Jensen Huang back as CEO.
Following his November 12 resignation amid internal investigations and scrutiny surrounding Megaspeed, the board appears focused on moving forward.
#NvidiaEarningsTonight:AIStocks’NextMove? #
Here’s what traders should watch:
🔹 **Leadership Transition:** CFO Colette Kress remains Interim CEO, working alongside new Board Chair Harvey C. Jones while a search firm looks for a permanent successor.
#NvidiaBoardNotConsideringHuang’sReturnasCEO
🔹 **Market Pressure:** Nvidia’s valuation has fallen from its $4.5 trillion peak to around $3.76 trillion, raising questions about confidence across the AI sector.
🔹 **The Big Catalyst:** Q3 earnings are now in focus. Data-center revenue, AI demand, and future capex guidance could decide the next major move.
This matters beyond NVDA. AI-related tokens like TAO, RENDER, FET, BLESS, and EVAA could also feel the impact if institutional confidence in AI spending changes.
The key question is simple: Is this leadership uncertainty already priced in, or could Nvidia’s earnings trigger another wave of volatility across the AI market?
I'm watching the earnings guidance closely. Hype can move prices, but real demand decides how long the rally lasts.
$NVDA $BLESS $EVAA
#NvidiaEarningsTonight:AIStocks’NextMove?
🚨 NVIDIA’s Leadership Shakeup Is Putting the AI Market on Alert.
A petition with over 180K signatures, support from Elon Musk, and positive remarks from Donald Trump still haven't changed the situation. Nvidia’s board reportedly has no plans to bring Jensen Huang back as CEO.
Following his November 12 resignation amid internal investigations and scrutiny surrounding Megaspeed, the board appears focused on moving forward.
#NvidiaEarningsTonight:AIStocks’NextMove? #
Here’s what traders should watch:
🔹 **Leadership Transition:** CFO Colette Kress remains Interim CEO, working alongside new Board Chair Harvey C. Jones while a search firm looks for a permanent successor.
#NvidiaBoardNotConsideringHuang’sReturnasCEO
🔹 **Market Pressure:** Nvidia’s valuation has fallen from its $4.5 trillion peak to around $3.76 trillion, raising questions about confidence across the AI sector.
🔹 **The Big Catalyst:** Q3 earnings are now in focus. Data-center revenue, AI demand, and future capex guidance could decide the next major move.
This matters beyond NVDA. AI-related tokens like TAO, RENDER, FET, BLESS, and EVAA could also feel the impact if institutional confidence in AI spending changes.
The key question is simple: Is this leadership uncertainty already priced in, or could Nvidia’s earnings trigger another wave of volatility across the AI market?
I'm watching the earnings guidance closely. Hype can move prices, but real demand decides how long the rally lasts.
$NVDA $BLESS $EVAA
#NvidiaEarningsTonight:AIStocks’NextMove?
A petition with over 180K signatures, support from Elon Musk, and positive remarks from Donald Trump still haven't changed the situation. Nvidia’s board reportedly has no plans to bring Jensen Huang back as CEO.
Following his November 12 resignation amid internal investigations and scrutiny surrounding Megaspeed, the board appears focused on moving forward.
#NvidiaEarningsTonight:AIStocks’NextMove? #
Here’s what traders should watch:
🔹 **Leadership Transition:** CFO Colette Kress remains Interim CEO, working alongside new Board Chair Harvey C. Jones while a search firm looks for a permanent successor.
#NvidiaBoardNotConsideringHuang’sReturnasCEO
🔹 **Market Pressure:** Nvidia’s valuation has fallen from its $4.5 trillion peak to around $3.76 trillion, raising questions about confidence across the AI sector.
🔹 **The Big Catalyst:** Q3 earnings are now in focus. Data-center revenue, AI demand, and future capex guidance could decide the next major move.
This matters beyond NVDA. AI-related tokens like TAO, RENDER, FET, BLESS, and EVAA could also feel the impact if institutional confidence in AI spending changes.
The key question is simple: Is this leadership uncertainty already priced in, or could Nvidia’s earnings trigger another wave of volatility across the AI market?
I'm watching the earnings guidance closely. Hype can move prices, but real demand decides how long the rally lasts.
$NVDA $BLESS $EVAA
#NvidiaEarningsTonight:AIStocks’NextMove?


6
9
1.8k
·
--
Bullish
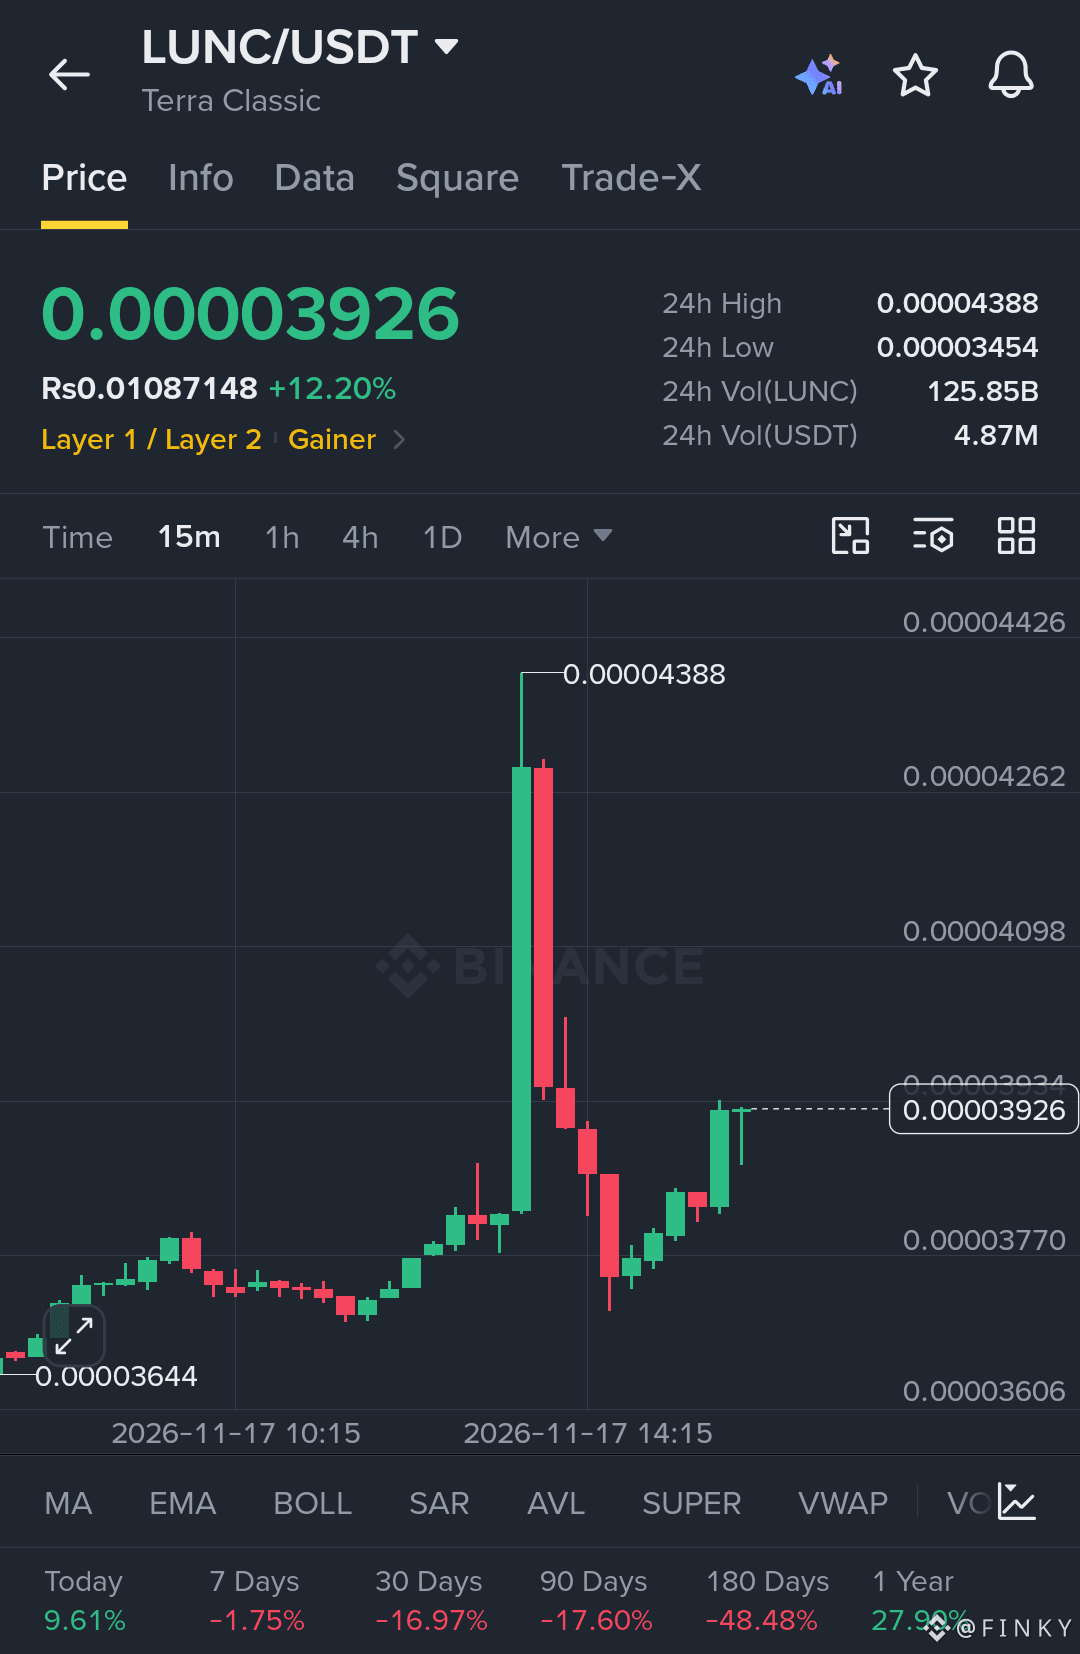
$LUNC is waking up, and buyers are trying to take control again.
LUNC is trading around $0.00003926, up 12.20% in 24 hours. Price surged to $0.00004388 before facing strong selling pressure. But the interesting part is the recovery after that sharp pullback.
Buyers are stepping back in, and price is approaching an important resistance zone around $0.00003934.
Key levels to watch:
- Current Price: $0.00003926
- Entry Zone: $0.00003850 – $0.00003930
- TP1: $0.00004098
- TP2: $0.00004262
- TP3: $0.00004388
- Stop Loss: $0.00003740
A clean breakout above $0.00003934 could open the door toward higher levels. However, rejection here could send LUNC back toward $0.00003770 support.
The 15-minute chart is showing a recovery, but confirmation matters. I want to see buyers hold the breakout rather than chase another sudden spike.
The next move could be interesting. Will LUNC reclaim $0.00004000 and continue its recovery?
Risk managed. Eyes on the targets. Let’s go $LUNC
{spot}(LUNCUSDT)
#AnthropicIPOTestsInvestorAppetiteForAI #NvidiaBoardNotConsideringHuang’sReturnasCEO #InvescoStablecoinReservesFundLaunchesOnEthereum
$LUNC is waking up, and buyers are trying to take control again.
LUNC is trading around $0.00003926, up 12.20% in 24 hours. Price surged to $0.00004388 before facing strong selling pressure. But the interesting part is the recovery after that sharp pullback.
Buyers are stepping back in, and price is approaching an important resistance zone around $0.00003934.
Key levels to watch:
- Current Price: $0.00003926
- Entry Zone: $0.00003850 – $0.00003930
- TP1: $0.00004098
- TP2: $0.00004262
- TP3: $0.00004388
- Stop Loss: $0.00003740
A clean breakout above $0.00003934 could open the door toward higher levels. However, rejection here could send LUNC back toward $0.00003770 support.
The 15-minute chart is showing a recovery, but confirmation matters. I want to see buyers hold the breakout rather than chase another sudden spike.
The next move could be interesting. Will LUNC reclaim $0.00004000 and continue its recovery?
Risk managed. Eyes on the targets. Let’s go $LUNC
#AnthropicIPOTestsInvestorAppetiteForAI #NvidiaBoardNotConsideringHuang’sReturnasCEO #InvescoStablecoinReservesFundLaunchesOnEthereum
LUNC is trading around $0.00003926, up 12.20% in 24 hours. Price surged to $0.00004388 before facing strong selling pressure. But the interesting part is the recovery after that sharp pullback.
Buyers are stepping back in, and price is approaching an important resistance zone around $0.00003934.
Key levels to watch:
- Current Price: $0.00003926
- Entry Zone: $0.00003850 – $0.00003930
- TP1: $0.00004098
- TP2: $0.00004262
- TP3: $0.00004388
- Stop Loss: $0.00003740
A clean breakout above $0.00003934 could open the door toward higher levels. However, rejection here could send LUNC back toward $0.00003770 support.
The 15-minute chart is showing a recovery, but confirmation matters. I want to see buyers hold the breakout rather than chase another sudden spike.
The next move could be interesting. Will LUNC reclaim $0.00004000 and continue its recovery?
Risk managed. Eyes on the targets. Let’s go $LUNC
#AnthropicIPOTestsInvestorAppetiteForAI #NvidiaBoardNotConsideringHuang’sReturnasCEO #InvescoStablecoinReservesFundLaunchesOnEthereum
4
443
·
--
Bullish
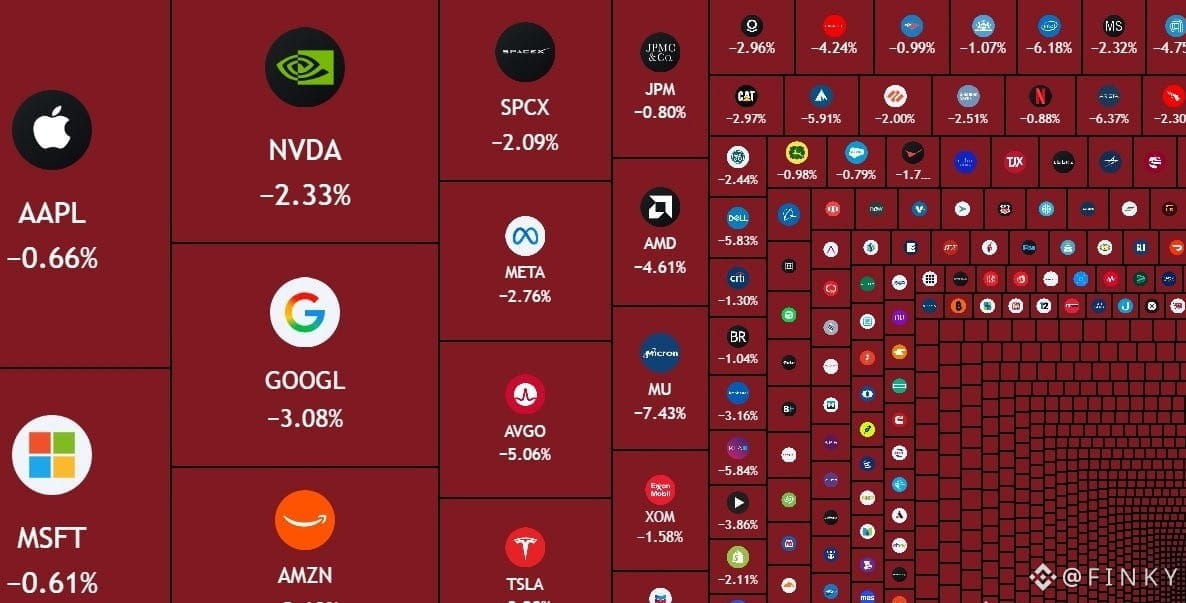
BREAKING: $1 TRILLION wiped out from the US stock market in just 40 minutes.
Wall Street is under serious pressure, and the selling is spreading fast.
Big Tech is taking a major hit. NVIDIA is down 2.33%, Google has dropped 3.08%, Amazon is losing 2.60%, Meta is down 2.76%, and AMD has fallen 4.61%.
But Micron is getting hit even harder, plunging 7.43%.
Apple, Microsoft, Tesla and Broadcom are also trading in the red.
This is bigger than one company. Selling pressure is spreading across the biggest names in the market, and investor confidence is being tested.
When trillion-dollar companies start falling together, the impact can reach far beyond Wall Street. Risk appetite can weaken, volatility can rise, and crypto markets may also feel the pressure.
The real question now is whether buyers step in to defend the market or sellers continue pushing prices lower.
One thing is certain: when fear takes over, billions can disappear in minutes.
Is this a temporary shakeout or the beginning of a deeper market correction?
#AnthropicIPOTestsInvestorAppetiteForAI #BitcoinExtendsLosingStreakToSixWeeks
BREAKING: $1 TRILLION wiped out from the US stock market in just 40 minutes.
Wall Street is under serious pressure, and the selling is spreading fast.
Big Tech is taking a major hit. NVIDIA is down 2.33%, Google has dropped 3.08%, Amazon is losing 2.60%, Meta is down 2.76%, and AMD has fallen 4.61%.
But Micron is getting hit even harder, plunging 7.43%.
Apple, Microsoft, Tesla and Broadcom are also trading in the red.
This is bigger than one company. Selling pressure is spreading across the biggest names in the market, and investor confidence is being tested.
When trillion-dollar companies start falling together, the impact can reach far beyond Wall Street. Risk appetite can weaken, volatility can rise, and crypto markets may also feel the pressure.
The real question now is whether buyers step in to defend the market or sellers continue pushing prices lower.
One thing is certain: when fear takes over, billions can disappear in minutes.
Is this a temporary shakeout or the beginning of a deeper market correction?
#AnthropicIPOTestsInvestorAppetiteForAI #BitcoinExtendsLosingStreakToSixWeeks
Wall Street is under serious pressure, and the selling is spreading fast.
Big Tech is taking a major hit. NVIDIA is down 2.33%, Google has dropped 3.08%, Amazon is losing 2.60%, Meta is down 2.76%, and AMD has fallen 4.61%.
But Micron is getting hit even harder, plunging 7.43%.
Apple, Microsoft, Tesla and Broadcom are also trading in the red.
This is bigger than one company. Selling pressure is spreading across the biggest names in the market, and investor confidence is being tested.
When trillion-dollar companies start falling together, the impact can reach far beyond Wall Street. Risk appetite can weaken, volatility can rise, and crypto markets may also feel the pressure.
The real question now is whether buyers step in to defend the market or sellers continue pushing prices lower.
One thing is certain: when fear takes over, billions can disappear in minutes.
Is this a temporary shakeout or the beginning of a deeper market correction?
#AnthropicIPOTestsInvestorAppetiteForAI #BitcoinExtendsLosingStreakToSixWeeks
336
·
--
Bullish
$AKE USDT is showing signs of a recovery, but one important resistance level could decide its next move.
AKE is trading around $0.010205, up 7.59%, after bouncing strongly from the $0.009733 low. Buyers have stepped in after a clear period of selling pressure, pushing price back above the $0.0100 zone.
Here’s what I’m watching:
Key Support: $0.01012 – $0.00990
Major Support: $0.009733
Immediate Resistance: $0.01034
Next Resistance: $0.01056 – $0.01078
The 15-minute chart shows a strong recovery candle, but sellers have already reacted around the $0.01030–$0.01034 area. The latest pullback makes this level even more important.
Bullish Scenario: If buyers defend $0.01012 and reclaim $0.01034, AKE could attempt another move toward $0.01056, followed by $0.01078.
Bearish Scenario: If price loses $0.01012, the recovery could weaken and open the door toward $0.00990 and potentially $0.009733.
Volume is already notable, with 24-hour trading volume around 179.39M USDT. That makes this move worth watching, but confirmation is still needed.
I'm not chasing the green candles here. I want to see buyers hold support and break resistance with strength.
The big question: Is AKE preparing for another leg up, or will sellers reject this recovery again?
Cash is a position. Let the market confirm first.
$ZEC $LAB
#AnthropicIPOTestsInvestorAppetiteForAI #BitcoinExtendsLosingStreakToSixWeeks #StablecoinMarketShrinksAtFastestPaceSinceTerraLuna #OPTIMJACKAttackInfectsAtLeast186Websites
$AKE USDT is showing signs of a recovery, but one important resistance level could decide its next move.
AKE is trading around $0.010205, up 7.59%, after bouncing strongly from the $0.009733 low. Buyers have stepped in after a clear period of selling pressure, pushing price back above the $0.0100 zone.
Here’s what I’m watching:
Key Support: $0.01012 – $0.00990
Major Support: $0.009733
Immediate Resistance: $0.01034
Next Resistance: $0.01056 – $0.01078
The 15-minute chart shows a strong recovery candle, but sellers have already reacted around the $0.01030–$0.01034 area. The latest pullback makes this level even more important.
Bullish Scenario: If buyers defend $0.01012 and reclaim $0.01034, AKE could attempt another move toward $0.01056, followed by $0.01078.
Bearish Scenario: If price loses $0.01012, the recovery could weaken and open the door toward $0.00990 and potentially $0.009733.
Volume is already notable, with 24-hour trading volume around 179.39M USDT. That makes this move worth watching, but confirmation is still needed.
I'm not chasing the green candles here. I want to see buyers hold support and break resistance with strength.
The big question: Is AKE preparing for another leg up, or will sellers reject this recovery again?
Cash is a position. Let the market confirm first.
$ZEC $LAB
#AnthropicIPOTestsInvestorAppetiteForAI #BitcoinExtendsLosingStreakToSixWeeks #StablecoinMarketShrinksAtFastestPaceSinceTerraLuna #OPTIMJACKAttackInfectsAtLeast186Websites
AKE is trading around $0.010205, up 7.59%, after bouncing strongly from the $0.009733 low. Buyers have stepped in after a clear period of selling pressure, pushing price back above the $0.0100 zone.
Here’s what I’m watching:
Key Support: $0.01012 – $0.00990
Major Support: $0.009733
Immediate Resistance: $0.01034
Next Resistance: $0.01056 – $0.01078
The 15-minute chart shows a strong recovery candle, but sellers have already reacted around the $0.01030–$0.01034 area. The latest pullback makes this level even more important.
Bullish Scenario: If buyers defend $0.01012 and reclaim $0.01034, AKE could attempt another move toward $0.01056, followed by $0.01078.
Bearish Scenario: If price loses $0.01012, the recovery could weaken and open the door toward $0.00990 and potentially $0.009733.
Volume is already notable, with 24-hour trading volume around 179.39M USDT. That makes this move worth watching, but confirmation is still needed.
I'm not chasing the green candles here. I want to see buyers hold support and break resistance with strength.
The big question: Is AKE preparing for another leg up, or will sellers reject this recovery again?
Cash is a position. Let the market confirm first.
$ZEC $LAB
#AnthropicIPOTestsInvestorAppetiteForAI #BitcoinExtendsLosingStreakToSixWeeks #StablecoinMarketShrinksAtFastestPaceSinceTerraLuna #OPTIMJACKAttackInfectsAtLeast186Websites
LONG
SHORT
9 hr(s) left
1
850
·
--
Bullish
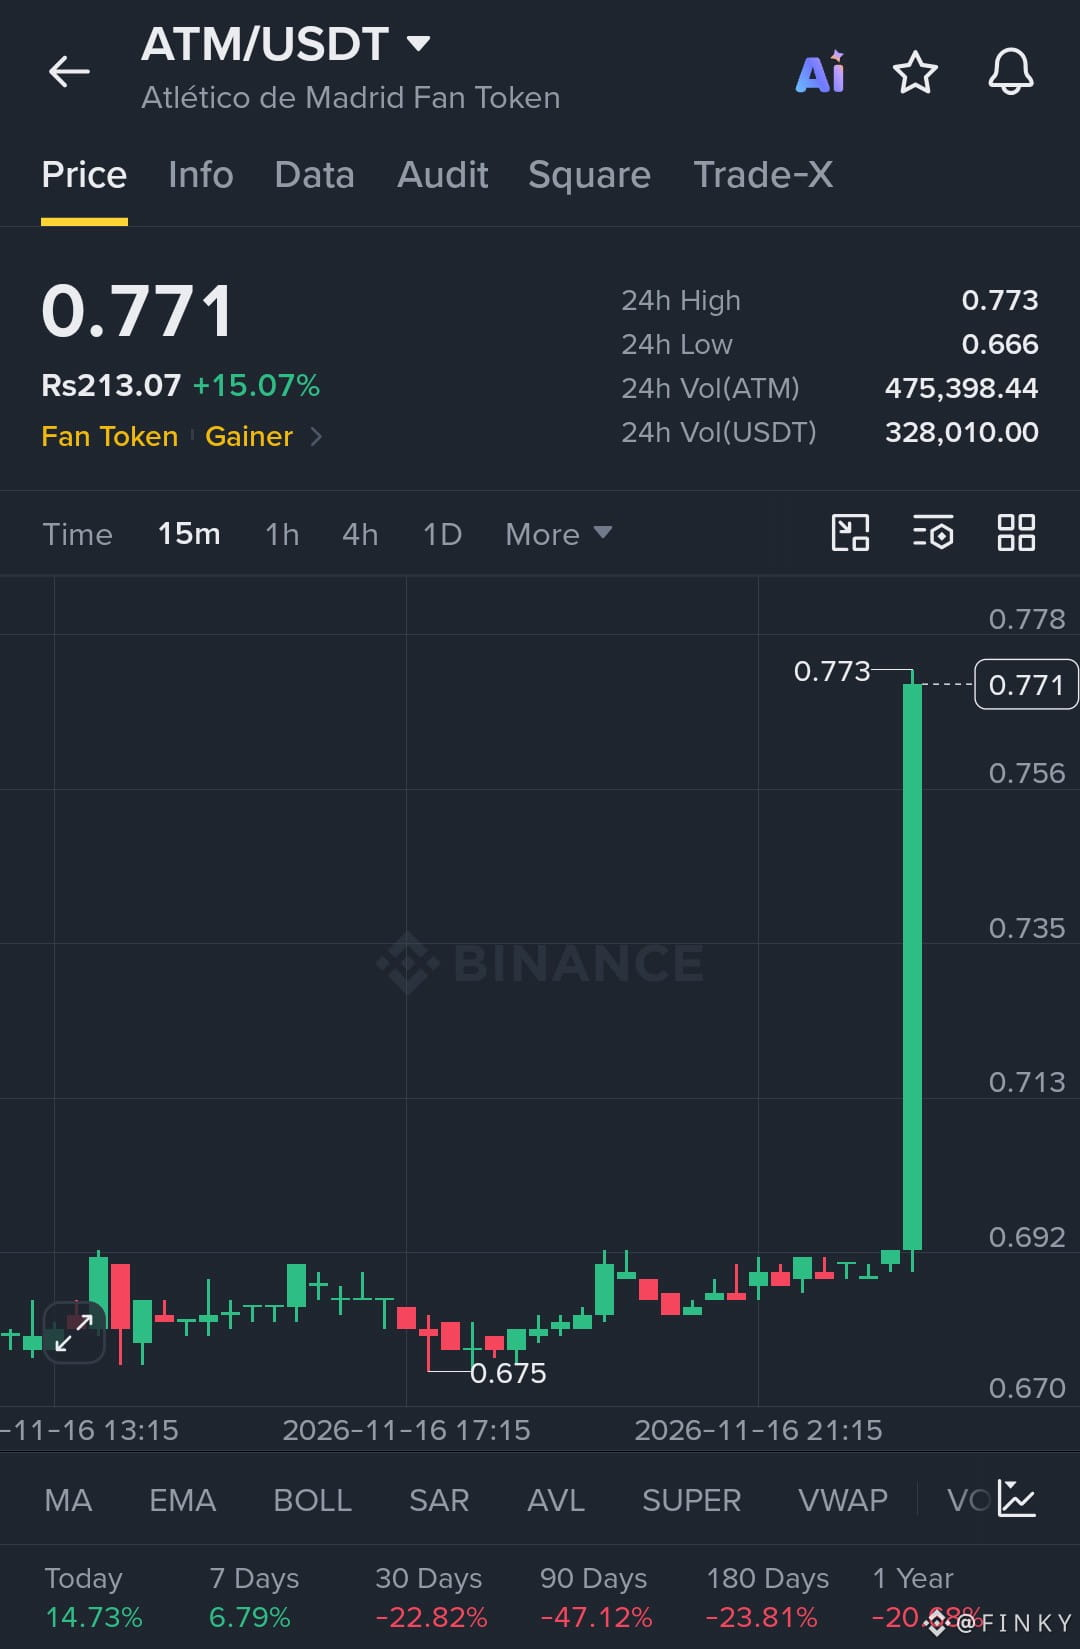
$ATM is waking up, and buyers have just made a serious move.
At $0.771, Atlético de Madrid Fan Token is up 15.07% in 24 hours, with price pushing close to its daily high of $0.773.
What caught my attention is the sudden breakout. ATM spent hours consolidating around $0.68–$0.69 before buyers stepped in with a powerful green candle and pushed price sharply higher.
Here are the key levels I'm watching:
- Current price: $0.771
- 24H high: $0.773
- 24H low: $0.666
- Major breakout area: $0.692
- Previous chart low: $0.675
- 24H trading volume: 475,398 ATM ($328K USDT)
The next important test is $0.773. A clean 15-minute candle close above this level could open the door for further upside.
But I don't want to chase a vertical candle. A retest of the breakout area would give buyers a chance to prove their strength.
If price loses $0.692, the breakout could weaken and a deeper pullback becomes possible.
One thing is clear: momentum has shifted, but confirmation still matters.
Will ATM break above $0.773 and continue running, or will sellers step in at resistance?
{spot}(ATMUSDT)
#AnthropicIPOTestsInvestorAppetiteForAI #HuangReportedlyConsidersReturnToNvidia #MUFGSMFGMizuhoPlanYenBackedStablecoin
$ATM is waking up, and buyers have just made a serious move.
At $0.771, Atlético de Madrid Fan Token is up 15.07% in 24 hours, with price pushing close to its daily high of $0.773.
What caught my attention is the sudden breakout. ATM spent hours consolidating around $0.68–$0.69 before buyers stepped in with a powerful green candle and pushed price sharply higher.
Here are the key levels I'm watching:
- Current price: $0.771
- 24H high: $0.773
- 24H low: $0.666
- Major breakout area: $0.692
- Previous chart low: $0.675
- 24H trading volume: 475,398 ATM ($328K USDT)
The next important test is $0.773. A clean 15-minute candle close above this level could open the door for further upside.
But I don't want to chase a vertical candle. A retest of the breakout area would give buyers a chance to prove their strength.
If price loses $0.692, the breakout could weaken and a deeper pullback becomes possible.
One thing is clear: momentum has shifted, but confirmation still matters.
Will ATM break above $0.773 and continue running, or will sellers step in at resistance?
#AnthropicIPOTestsInvestorAppetiteForAI #HuangReportedlyConsidersReturnToNvidia #MUFGSMFGMizuhoPlanYenBackedStablecoin
At $0.771, Atlético de Madrid Fan Token is up 15.07% in 24 hours, with price pushing close to its daily high of $0.773.
What caught my attention is the sudden breakout. ATM spent hours consolidating around $0.68–$0.69 before buyers stepped in with a powerful green candle and pushed price sharply higher.
Here are the key levels I'm watching:
- Current price: $0.771
- 24H high: $0.773
- 24H low: $0.666
- Major breakout area: $0.692
- Previous chart low: $0.675
- 24H trading volume: 475,398 ATM ($328K USDT)
The next important test is $0.773. A clean 15-minute candle close above this level could open the door for further upside.
But I don't want to chase a vertical candle. A retest of the breakout area would give buyers a chance to prove their strength.
If price loses $0.692, the breakout could weaken and a deeper pullback becomes possible.
One thing is clear: momentum has shifted, but confirmation still matters.
Will ATM break above $0.773 and continue running, or will sellers step in at resistance?
#AnthropicIPOTestsInvestorAppetiteForAI #HuangReportedlyConsidersReturnToNvidia #MUFGSMFGMizuhoPlanYenBackedStablecoin
3
2
306
·
--
Bullish
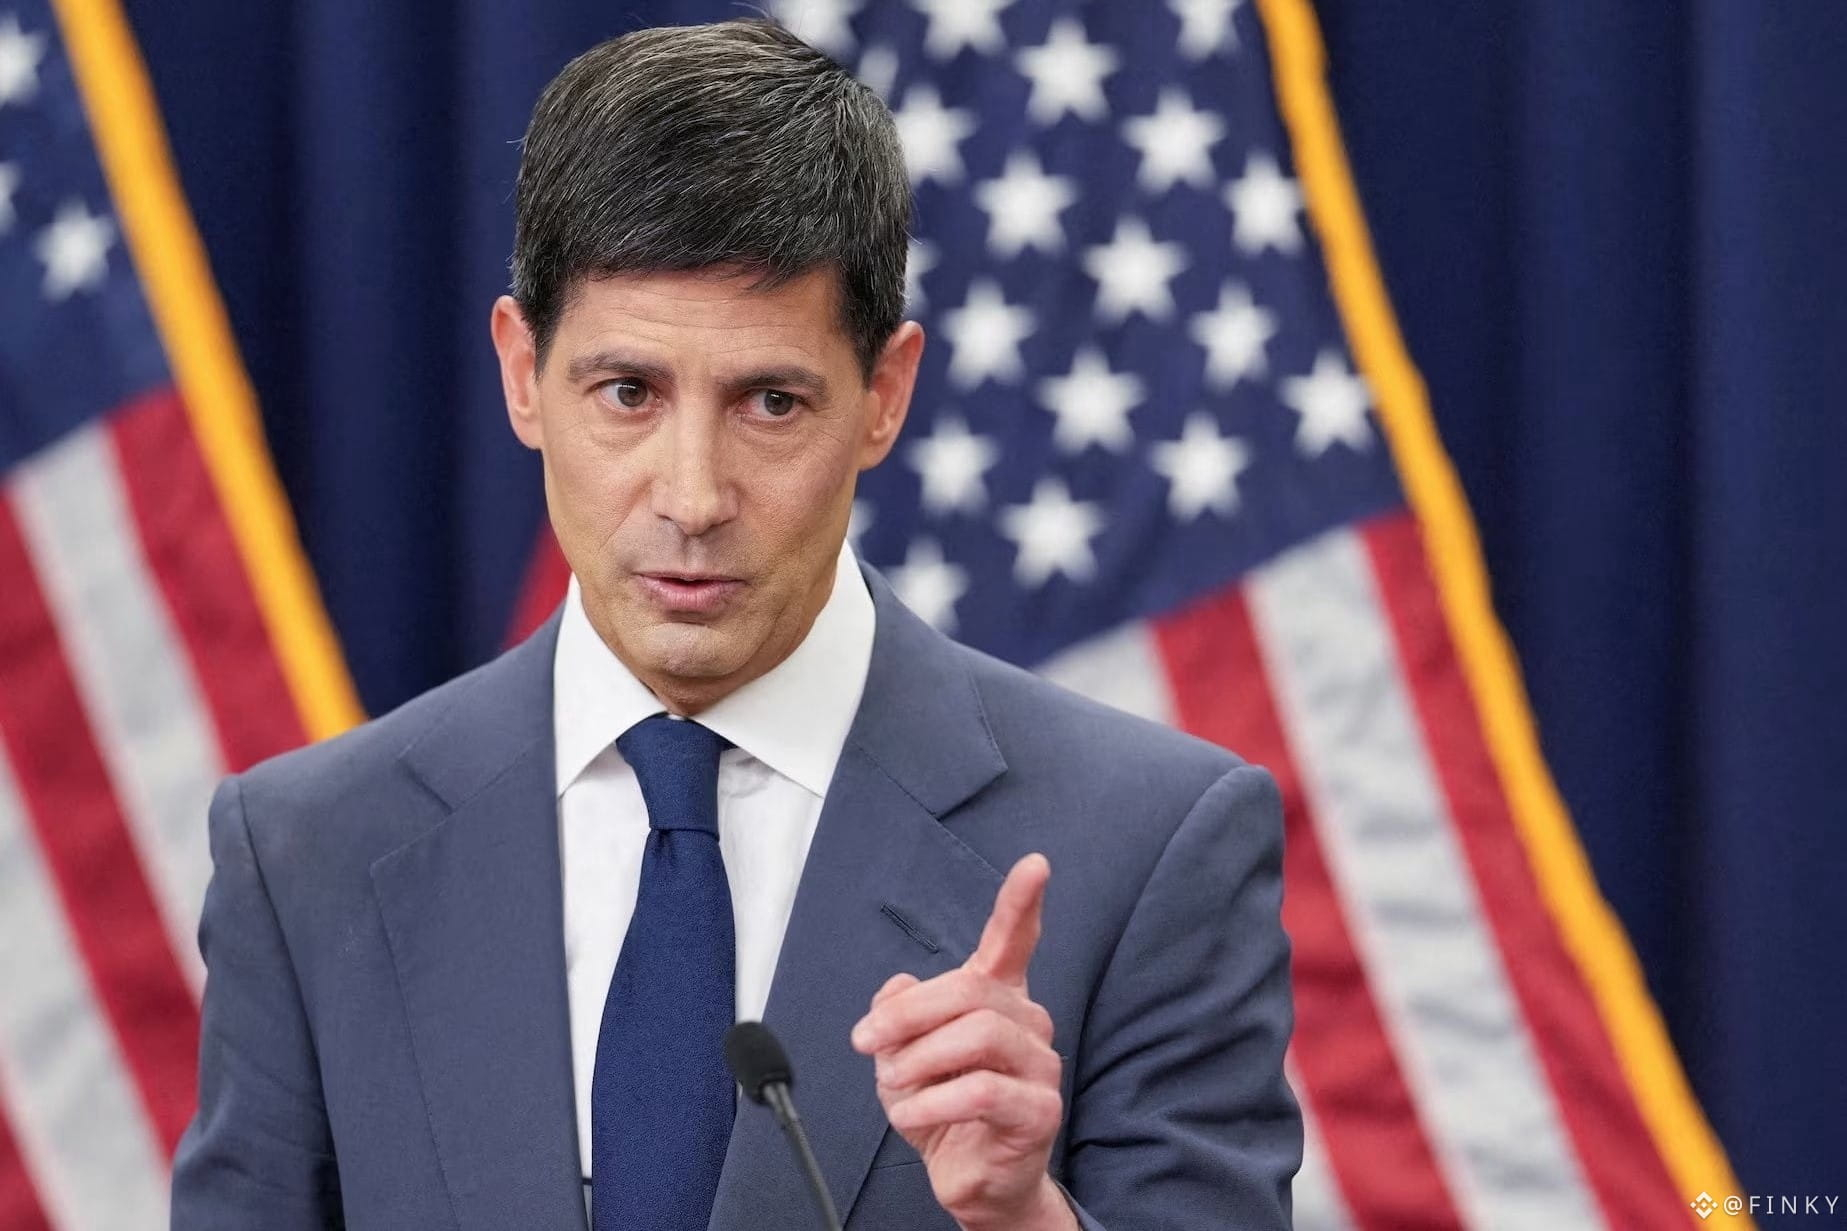
🚨 JUST IN: FED CHAIR WARSH SOUNDS THE ALARM ON AI! 🇺🇸
Federal Reserve Chair Kevin Warsh warns that artificial intelligence could bring major economic disruption.
AI has the power to boost productivity and accelerate economic growth, but the other side is concerning: job losses, rising unemployment, falling stock valuations, and a possible economic slowdown if expectations fail.
This is bigger than a technology story. It could reshape the global economy and influence future Fed policy.
Markets need to pay attention. Any major economic shift could create serious volatility across crypto.
$BTC $BNB $NEAR — Is AI becoming the next major market catalyst?
{spot}(BTCUSDT)
{spot}(BNBUSDT)
{spot}(NEARUSDT)
#AnthropicIPOTestsInvestorAppetiteForAI #BitcoinExtendsLosingStreakToSixWeeks #HuangReportedlyConsidersReturnToNvidia #MUFGSMFGMizuhoPlanYenBackedStablecoin
🚨 JUST IN: FED CHAIR WARSH SOUNDS THE ALARM ON AI! 🇺🇸
Federal Reserve Chair Kevin Warsh warns that artificial intelligence could bring major economic disruption.
AI has the power to boost productivity and accelerate economic growth, but the other side is concerning: job losses, rising unemployment, falling stock valuations, and a possible economic slowdown if expectations fail.
This is bigger than a technology story. It could reshape the global economy and influence future Fed policy.
Markets need to pay attention. Any major economic shift could create serious volatility across crypto.
$BTC $BNB $NEAR — Is AI becoming the next major market catalyst?
#AnthropicIPOTestsInvestorAppetiteForAI #BitcoinExtendsLosingStreakToSixWeeks #HuangReportedlyConsidersReturnToNvidia #MUFGSMFGMizuhoPlanYenBackedStablecoin
Federal Reserve Chair Kevin Warsh warns that artificial intelligence could bring major economic disruption.
AI has the power to boost productivity and accelerate economic growth, but the other side is concerning: job losses, rising unemployment, falling stock valuations, and a possible economic slowdown if expectations fail.
This is bigger than a technology story. It could reshape the global economy and influence future Fed policy.
Markets need to pay attention. Any major economic shift could create serious volatility across crypto.
$BTC $BNB $NEAR — Is AI becoming the next major market catalyst?
#AnthropicIPOTestsInvestorAppetiteForAI #BitcoinExtendsLosingStreakToSixWeeks #HuangReportedlyConsidersReturnToNvidia #MUFGSMFGMizuhoPlanYenBackedStablecoin
1
232
·
--
Bullish
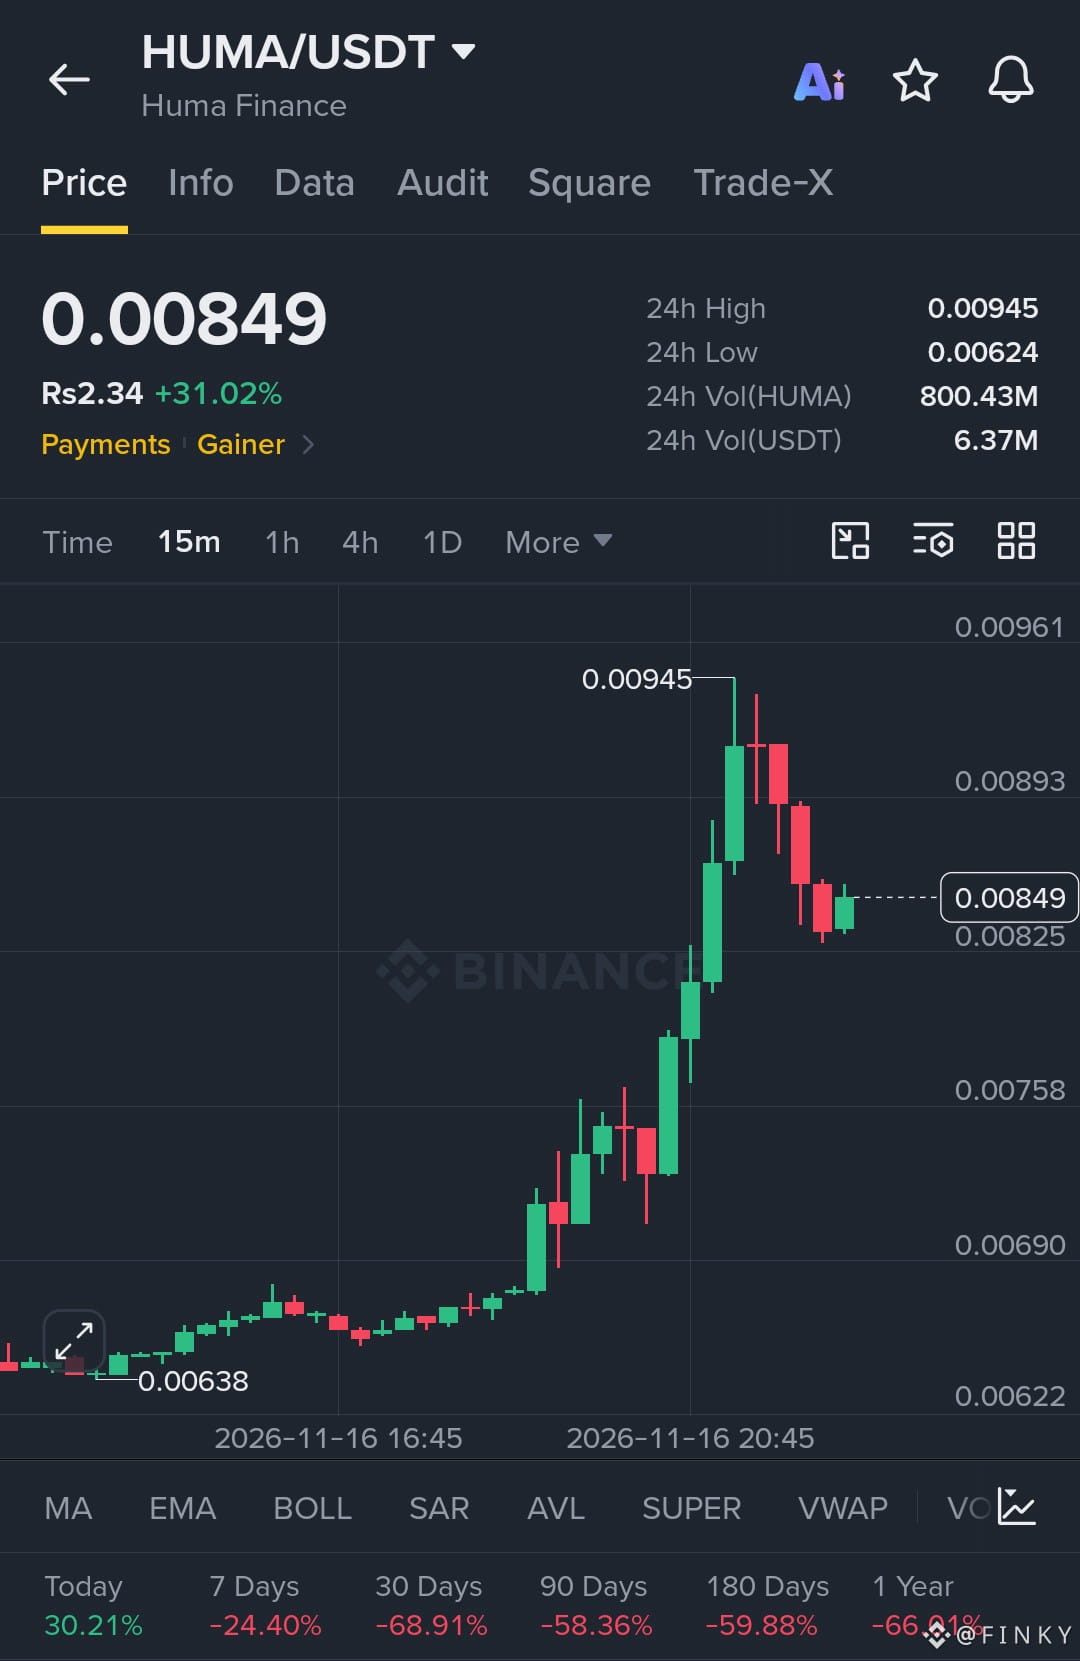
🚀 $HUMA IS EXPLODING! BUYERS ARE BACK IN CONTROL!
HUMA Finance is making a serious move, trading at $0.00849, up 31.02% in 24 hours. After spending time near $0.00638, buyers stepped in aggressively and pushed price all the way to $0.00945.
But the interesting part is what happens next.
The 15-minute chart shows a powerful breakout followed by profit-taking near $0.00945. Price has pulled back toward $0.00825 and is now attempting to stabilize around $0.00849. This is the area I'm watching closely.
Key levels to watch:
- Current Price: $0.00849
- Immediate Support: $0.00825
- Strong Support: $0.00758
- Major Support: $0.00690
- Immediate Resistance: $0.00893
- Major Resistance: $0.00945
Bullish Scenario: If HUMA holds $0.00825 and reclaims $0.00893, buyers could make another attempt toward $0.00945. A clean breakout above that high could open the door for further upside.
Bearish Scenario: If $0.00825 fails, expect a possible correction toward $0.00758. Losing that level would weaken the short-term recovery.
Volume is also worth watching, with 800.43M HUMA traded over 24 hours, equivalent to $6.37M in USDT volume.
Despite today's strong rally, HUMA remains down 24.40% over seven days and 68.91% over 30 days. One powerful pump does not confirm a complete trend reversal.
I'm watching the $0.00893 breakout level. Confirmation matters more than chasing green candles.
Can $HUMA reclaim $0.00945 and start another rally, or will sellers take control again?
{spot}(HUMAUSDT)
#AnthropicIPOTestsInvestorAppetiteForAI #HuangReportedlyConsidersReturnToNvidia #CaliforniaVotersBackProp42BarringNewCryptoTaxes #MUFGSMFGMizuhoPlanYenBackedStablecoin
🚀 $HUMA IS EXPLODING! BUYERS ARE BACK IN CONTROL!
HUMA Finance is making a serious move, trading at $0.00849, up 31.02% in 24 hours. After spending time near $0.00638, buyers stepped in aggressively and pushed price all the way to $0.00945.
But the interesting part is what happens next.
The 15-minute chart shows a powerful breakout followed by profit-taking near $0.00945. Price has pulled back toward $0.00825 and is now attempting to stabilize around $0.00849. This is the area I'm watching closely.
Key levels to watch:
- Current Price: $0.00849
- Immediate Support: $0.00825
- Strong Support: $0.00758
- Major Support: $0.00690
- Immediate Resistance: $0.00893
- Major Resistance: $0.00945
Bullish Scenario: If HUMA holds $0.00825 and reclaims $0.00893, buyers could make another attempt toward $0.00945. A clean breakout above that high could open the door for further upside.
Bearish Scenario: If $0.00825 fails, expect a possible correction toward $0.00758. Losing that level would weaken the short-term recovery.
Volume is also worth watching, with 800.43M HUMA traded over 24 hours, equivalent to $6.37M in USDT volume.
Despite today's strong rally, HUMA remains down 24.40% over seven days and 68.91% over 30 days. One powerful pump does not confirm a complete trend reversal.
I'm watching the $0.00893 breakout level. Confirmation matters more than chasing green candles.
Can $HUMA reclaim $0.00945 and start another rally, or will sellers take control again?
#AnthropicIPOTestsInvestorAppetiteForAI #HuangReportedlyConsidersReturnToNvidia #CaliforniaVotersBackProp42BarringNewCryptoTaxes #MUFGSMFGMizuhoPlanYenBackedStablecoin
HUMA Finance is making a serious move, trading at $0.00849, up 31.02% in 24 hours. After spending time near $0.00638, buyers stepped in aggressively and pushed price all the way to $0.00945.
But the interesting part is what happens next.
The 15-minute chart shows a powerful breakout followed by profit-taking near $0.00945. Price has pulled back toward $0.00825 and is now attempting to stabilize around $0.00849. This is the area I'm watching closely.
Key levels to watch:
- Current Price: $0.00849
- Immediate Support: $0.00825
- Strong Support: $0.00758
- Major Support: $0.00690
- Immediate Resistance: $0.00893
- Major Resistance: $0.00945
Bullish Scenario: If HUMA holds $0.00825 and reclaims $0.00893, buyers could make another attempt toward $0.00945. A clean breakout above that high could open the door for further upside.
Bearish Scenario: If $0.00825 fails, expect a possible correction toward $0.00758. Losing that level would weaken the short-term recovery.
Volume is also worth watching, with 800.43M HUMA traded over 24 hours, equivalent to $6.37M in USDT volume.
Despite today's strong rally, HUMA remains down 24.40% over seven days and 68.91% over 30 days. One powerful pump does not confirm a complete trend reversal.
I'm watching the $0.00893 breakout level. Confirmation matters more than chasing green candles.
Can $HUMA reclaim $0.00945 and start another rally, or will sellers take control again?
#AnthropicIPOTestsInvestorAppetiteForAI #HuangReportedlyConsidersReturnToNvidia #CaliforniaVotersBackProp42BarringNewCryptoTaxes #MUFGSMFGMizuhoPlanYenBackedStablecoin
1
356
·
--
Bullish
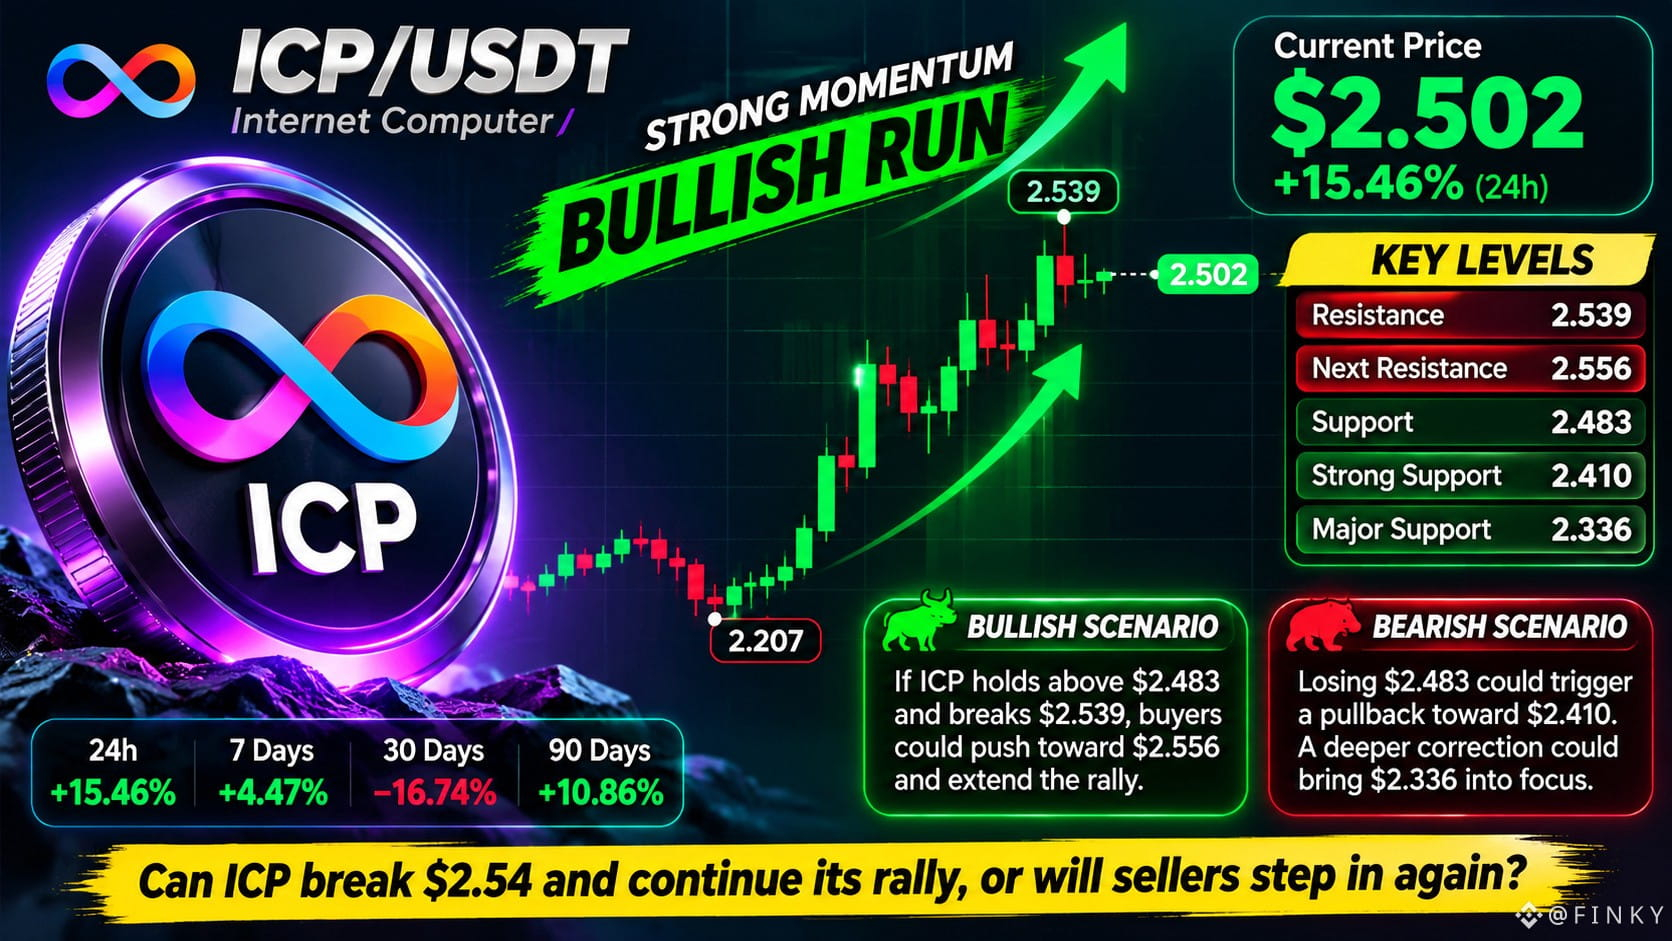
🚀 $ICP IS ON A STRONG BULLISH RUN!
Internet Computer is catching serious attention, trading at $2.502, up 15.46% in 24 hours. Buyers have taken control after defending the $2.207 low, pushing price through several resistance levels with strong green candles.
The 15-minute chart shows a clear shift in momentum. ICP has climbed from $2.20 toward $2.54, and price is now consolidating near $2.50 after a small rejection from the daily high.
Key levels to watch:
- Current Price: $2.502
- Immediate Support: $2.483
- Strong Support: $2.410
- Major Support: $2.336
- Resistance: $2.539
- Next Upside Zone: $2.556
Bullish Scenario: If ICP holds above $2.483 and breaks $2.539, buyers could push toward $2.556 and potentially extend the rally.
Bearish Scenario: Losing $2.483 could trigger a pullback toward $2.410. A deeper correction could bring $2.336 into focus.
The momentum is impressive, but chasing a sharp rally is risky. ICP is up 4.47% over seven days and 10.86% over 90 days, while the 30-day performance remains down 16.74%. The bigger recovery still needs confirmation.
I'm watching $2.539 closely. A clean breakout could open the door to another leg higher, but holding support is equally important.
Can ICP break $2.54 and continue its rally, or will sellers step in again?
{spot}(ICPUSDT)
#ICP #AnthropicIPOTestsInvestorAppetiteForAI
🚀 $ICP IS ON A STRONG BULLISH RUN!
Internet Computer is catching serious attention, trading at $2.502, up 15.46% in 24 hours. Buyers have taken control after defending the $2.207 low, pushing price through several resistance levels with strong green candles.
The 15-minute chart shows a clear shift in momentum. ICP has climbed from $2.20 toward $2.54, and price is now consolidating near $2.50 after a small rejection from the daily high.
Key levels to watch:
- Current Price: $2.502
- Immediate Support: $2.483
- Strong Support: $2.410
- Major Support: $2.336
- Resistance: $2.539
- Next Upside Zone: $2.556
Bullish Scenario: If ICP holds above $2.483 and breaks $2.539, buyers could push toward $2.556 and potentially extend the rally.
Bearish Scenario: Losing $2.483 could trigger a pullback toward $2.410. A deeper correction could bring $2.336 into focus.
The momentum is impressive, but chasing a sharp rally is risky. ICP is up 4.47% over seven days and 10.86% over 90 days, while the 30-day performance remains down 16.74%. The bigger recovery still needs confirmation.
I'm watching $2.539 closely. A clean breakout could open the door to another leg higher, but holding support is equally important.
Can ICP break $2.54 and continue its rally, or will sellers step in again?
#ICP #AnthropicIPOTestsInvestorAppetiteForAI
Internet Computer is catching serious attention, trading at $2.502, up 15.46% in 24 hours. Buyers have taken control after defending the $2.207 low, pushing price through several resistance levels with strong green candles.
The 15-minute chart shows a clear shift in momentum. ICP has climbed from $2.20 toward $2.54, and price is now consolidating near $2.50 after a small rejection from the daily high.
Key levels to watch:
- Current Price: $2.502
- Immediate Support: $2.483
- Strong Support: $2.410
- Major Support: $2.336
- Resistance: $2.539
- Next Upside Zone: $2.556
Bullish Scenario: If ICP holds above $2.483 and breaks $2.539, buyers could push toward $2.556 and potentially extend the rally.
Bearish Scenario: Losing $2.483 could trigger a pullback toward $2.410. A deeper correction could bring $2.336 into focus.
The momentum is impressive, but chasing a sharp rally is risky. ICP is up 4.47% over seven days and 10.86% over 90 days, while the 30-day performance remains down 16.74%. The bigger recovery still needs confirmation.
I'm watching $2.539 closely. A clean breakout could open the door to another leg higher, but holding support is equally important.
Can ICP break $2.54 and continue its rally, or will sellers step in again?
#ICP #AnthropicIPOTestsInvestorAppetiteForAI
1
2
395
·
--
Bullish
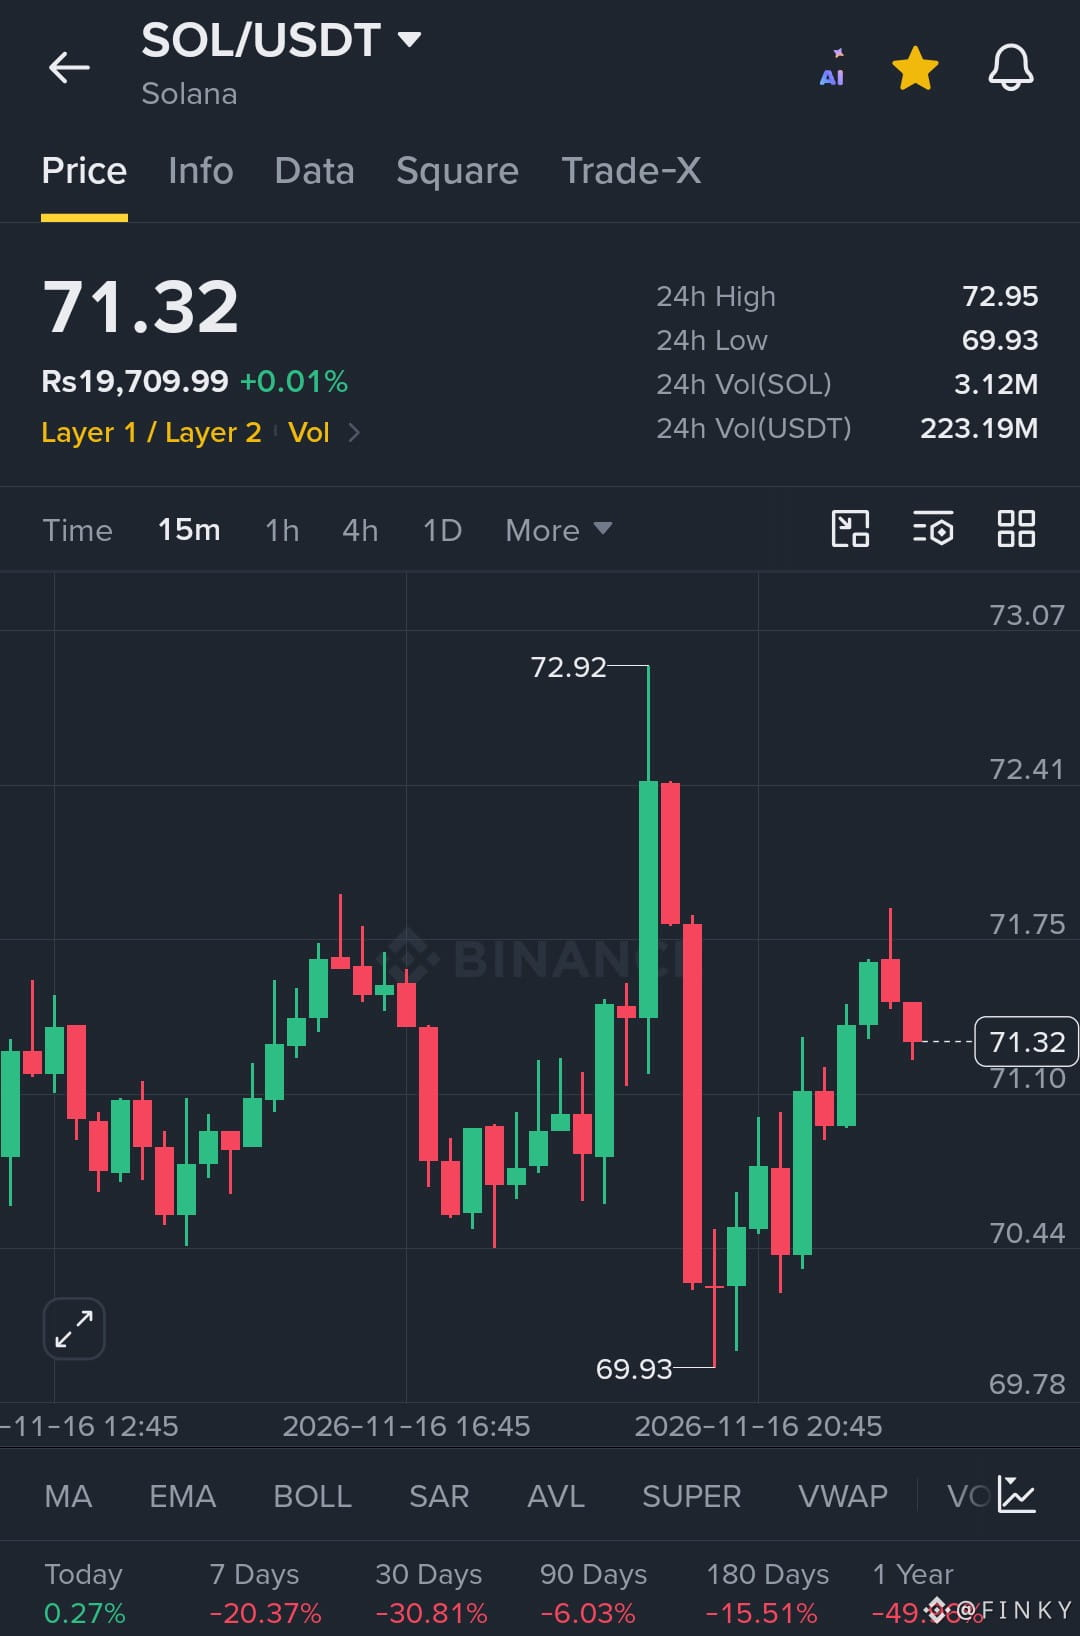
🚨 $SOL IS FIGHTING FOR A COMEBACK!
Solana is trading around $71.32, trying to recover after a sharp sell-off that pushed price down to $69.93. Buyers stepped in aggressively, bringing SOL back above $71, but the recovery is now facing another important test.
The 15-minute chart shows a strong rejection near $72.92, followed by a quick drop. Since then, buyers have managed to rebuild momentum, but the $71.75–$72.00 zone remains an important resistance area.
Key levels to watch:
- Current Price: $71.32
- Support: $71.10
- Stronger Support: $70.44
- Major Support: $69.93
- Resistance: $71.75
- Major Resistance: $72.41–$72.92
Bullish Scenario: If SOL holds above $71.10 and breaks $71.75, buyers could push toward $72.41 and potentially retest $72.92.
Bearish Scenario: Losing $71.10 could bring another test of $70.44. A breakdown below that level would put $69.93 back in focus.
The bigger picture still needs work. SOL is down 20.37% over seven days and 30.81% over 30 days. One short-term recovery is not enough to confirm a full trend reversal.
I'm watching $71.75 closely. A clean breakout could change the short-term picture, but failure to hold support may bring sellers back into control.
Will SOL finally reclaim $72, or is another rejection coming?
{spot}(SOLUSDT)
#AnthropicIPOTestsInvestorAppetiteForAI #BitcoinExtendsLosingStreakToSixWeeks #HuangReportedlyConsidersReturnToNvidia #MUFGSMFGMizuhoPlanYenBackedStablecoin #CaliforniaVotersBackProp42BarringNewCryptoTaxes
🚨 $SOL IS FIGHTING FOR A COMEBACK!
Solana is trading around $71.32, trying to recover after a sharp sell-off that pushed price down to $69.93. Buyers stepped in aggressively, bringing SOL back above $71, but the recovery is now facing another important test.
The 15-minute chart shows a strong rejection near $72.92, followed by a quick drop. Since then, buyers have managed to rebuild momentum, but the $71.75–$72.00 zone remains an important resistance area.
Key levels to watch:
- Current Price: $71.32
- Support: $71.10
- Stronger Support: $70.44
- Major Support: $69.93
- Resistance: $71.75
- Major Resistance: $72.41–$72.92
Bullish Scenario: If SOL holds above $71.10 and breaks $71.75, buyers could push toward $72.41 and potentially retest $72.92.
Bearish Scenario: Losing $71.10 could bring another test of $70.44. A breakdown below that level would put $69.93 back in focus.
The bigger picture still needs work. SOL is down 20.37% over seven days and 30.81% over 30 days. One short-term recovery is not enough to confirm a full trend reversal.
I'm watching $71.75 closely. A clean breakout could change the short-term picture, but failure to hold support may bring sellers back into control.
Will SOL finally reclaim $72, or is another rejection coming?
#AnthropicIPOTestsInvestorAppetiteForAI #BitcoinExtendsLosingStreakToSixWeeks #HuangReportedlyConsidersReturnToNvidia #MUFGSMFGMizuhoPlanYenBackedStablecoin #CaliforniaVotersBackProp42BarringNewCryptoTaxes
Solana is trading around $71.32, trying to recover after a sharp sell-off that pushed price down to $69.93. Buyers stepped in aggressively, bringing SOL back above $71, but the recovery is now facing another important test.
The 15-minute chart shows a strong rejection near $72.92, followed by a quick drop. Since then, buyers have managed to rebuild momentum, but the $71.75–$72.00 zone remains an important resistance area.
Key levels to watch:
- Current Price: $71.32
- Support: $71.10
- Stronger Support: $70.44
- Major Support: $69.93
- Resistance: $71.75
- Major Resistance: $72.41–$72.92
Bullish Scenario: If SOL holds above $71.10 and breaks $71.75, buyers could push toward $72.41 and potentially retest $72.92.
Bearish Scenario: Losing $71.10 could bring another test of $70.44. A breakdown below that level would put $69.93 back in focus.
The bigger picture still needs work. SOL is down 20.37% over seven days and 30.81% over 30 days. One short-term recovery is not enough to confirm a full trend reversal.
I'm watching $71.75 closely. A clean breakout could change the short-term picture, but failure to hold support may bring sellers back into control.
Will SOL finally reclaim $72, or is another rejection coming?
#AnthropicIPOTestsInvestorAppetiteForAI #BitcoinExtendsLosingStreakToSixWeeks #HuangReportedlyConsidersReturnToNvidia #MUFGSMFGMizuhoPlanYenBackedStablecoin #CaliforniaVotersBackProp42BarringNewCryptoTaxes
302
·
--
Bullish
$NVDA is showing signs of a short-term recovery, but the next move will be important.
Trading around $160.11, NVDA is down 0.59% over 24 hours, with a high of $166.95 and a low of $155.78. Trading volume has reached 11.01M NVDA, worth around $1.77B USDT.
On the 1-minute chart, buyers stepped in strongly after the price dropped to $158.71, pushing it up to $160.34. Now price is consolidating near $160.12.
#CPITestsDecemberRateOutlook
Here’s what I’m watching:
Resistance: $160.34
Immediate support: $159.70
Major downside level: $158.71
A clean break above $160.34 could open the door for another upward move. But if buyers lose control and price slips below $159.70, a retest of lower levels becomes possible.
The recovery looks promising, but confirmation matters more than excitement.
Will buyers push NVDA higher, or is this just a temporary bounce?
#HuangReportedlyConsidersReturnToNvidia #MUFGSMFGMizuhoPlanYenBackedStablecoin #BitcoinExtendsLosingStreakToSixWeeks #CaliforniaVotersBackProp42BarringNewCryptoTaxes
$NVDA is showing signs of a short-term recovery, but the next move will be important.
Trading around $160.11, NVDA is down 0.59% over 24 hours, with a high of $166.95 and a low of $155.78. Trading volume has reached 11.01M NVDA, worth around $1.77B USDT.
On the 1-minute chart, buyers stepped in strongly after the price dropped to $158.71, pushing it up to $160.34. Now price is consolidating near $160.12.
#CPITestsDecemberRateOutlook
Here’s what I’m watching:
Resistance: $160.34
Immediate support: $159.70
Major downside level: $158.71
A clean break above $160.34 could open the door for another upward move. But if buyers lose control and price slips below $159.70, a retest of lower levels becomes possible.
The recovery looks promising, but confirmation matters more than excitement.
Will buyers push NVDA higher, or is this just a temporary bounce?
#HuangReportedlyConsidersReturnToNvidia #MUFGSMFGMizuhoPlanYenBackedStablecoin #BitcoinExtendsLosingStreakToSixWeeks #CaliforniaVotersBackProp42BarringNewCryptoTaxes
Trading around $160.11, NVDA is down 0.59% over 24 hours, with a high of $166.95 and a low of $155.78. Trading volume has reached 11.01M NVDA, worth around $1.77B USDT.
On the 1-minute chart, buyers stepped in strongly after the price dropped to $158.71, pushing it up to $160.34. Now price is consolidating near $160.12.
#CPITestsDecemberRateOutlook
Here’s what I’m watching:
Resistance: $160.34
Immediate support: $159.70
Major downside level: $158.71
A clean break above $160.34 could open the door for another upward move. But if buyers lose control and price slips below $159.70, a retest of lower levels becomes possible.
The recovery looks promising, but confirmation matters more than excitement.
Will buyers push NVDA higher, or is this just a temporary bounce?
#HuangReportedlyConsidersReturnToNvidia #MUFGSMFGMizuhoPlanYenBackedStablecoin #BitcoinExtendsLosingStreakToSixWeeks #CaliforniaVotersBackProp42BarringNewCryptoTaxes

228
·
--
Bullish
🚨Bitcoin’s latest crash is not happening for just one reason. CZ has pointed to six major factors putting pressure on the crypto market, and the bigger picture deserves attention.
Here’s what’s happening:
1. **Anthropic’s massive listing:** Investors may be moving money into the upcoming stock listing, which could raise around $64 billion.
2. **Bitcoin ETF outflows:** US spot Bitcoin ETFs have recorded $1.91 billion in outflows over seven consecutive sessions. That is serious selling pressure.
3. **Security fears:** The Binance hack, iPhone wallet attacks, and Microsoft outage have added more uncertainty to an already nervous market.
4. **Hot US inflation:** Rising inflation has brought the possibility of another December Fed rate hike back into focus.
5. **Stronger dollar and bond yields:** Higher yields and a stronger dollar are pulling capital away from risky assets like Bitcoin.
6. **US political uncertainty:** Election results have raised concerns about potentially tougher crypto regulations.
But CZ added something interesting: he bought crypto himself over the past few days and said Binance did not sell during this market decline.
**Now, all eyes are on Bitcoin.**
BTC has bounced from $62,006 and is trading near $65,000, but the recovery is not confirmed yet.
$62,000 is the key support buyers must defend. On the upside, $67,750 is the major resistance Bitcoin needs to reclaim.
If buyers hold support and build momentum, another move toward $67,750 could be on the table. But losing $62,000 could open the door to further downside.
This market is testing confidence, liquidity, and patience.
The real question is simple: Is this a healthy correction before recovery, or is Bitcoin preparing for another leg down?
I'm watching $62,000 very closely. No need to rush into a trade before confirmation.
$BTC
{spot}(BTCUSDT)
#BitcoinExtendsLosingStreakToSixWeeks #HuangReportedlyConsidersReturnToNvidia
🚨Bitcoin’s latest crash is not happening for just one reason. CZ has pointed to six major factors putting pressure on the crypto market, and the bigger picture deserves attention.
Here’s what’s happening:
1. **Anthropic’s massive listing:** Investors may be moving money into the upcoming stock listing, which could raise around $64 billion.
2. **Bitcoin ETF outflows:** US spot Bitcoin ETFs have recorded $1.91 billion in outflows over seven consecutive sessions. That is serious selling pressure.
3. **Security fears:** The Binance hack, iPhone wallet attacks, and Microsoft outage have added more uncertainty to an already nervous market.
4. **Hot US inflation:** Rising inflation has brought the possibility of another December Fed rate hike back into focus.
5. **Stronger dollar and bond yields:** Higher yields and a stronger dollar are pulling capital away from risky assets like Bitcoin.
6. **US political uncertainty:** Election results have raised concerns about potentially tougher crypto regulations.
But CZ added something interesting: he bought crypto himself over the past few days and said Binance did not sell during this market decline.
**Now, all eyes are on Bitcoin.**
BTC has bounced from $62,006 and is trading near $65,000, but the recovery is not confirmed yet.
$62,000 is the key support buyers must defend. On the upside, $67,750 is the major resistance Bitcoin needs to reclaim.
If buyers hold support and build momentum, another move toward $67,750 could be on the table. But losing $62,000 could open the door to further downside.
This market is testing confidence, liquidity, and patience.
The real question is simple: Is this a healthy correction before recovery, or is Bitcoin preparing for another leg down?
I'm watching $62,000 very closely. No need to rush into a trade before confirmation.
$BTC
#BitcoinExtendsLosingStreakToSixWeeks #HuangReportedlyConsidersReturnToNvidia
Here’s what’s happening:
1. **Anthropic’s massive listing:** Investors may be moving money into the upcoming stock listing, which could raise around $64 billion.
2. **Bitcoin ETF outflows:** US spot Bitcoin ETFs have recorded $1.91 billion in outflows over seven consecutive sessions. That is serious selling pressure.
3. **Security fears:** The Binance hack, iPhone wallet attacks, and Microsoft outage have added more uncertainty to an already nervous market.
4. **Hot US inflation:** Rising inflation has brought the possibility of another December Fed rate hike back into focus.
5. **Stronger dollar and bond yields:** Higher yields and a stronger dollar are pulling capital away from risky assets like Bitcoin.
6. **US political uncertainty:** Election results have raised concerns about potentially tougher crypto regulations.
But CZ added something interesting: he bought crypto himself over the past few days and said Binance did not sell during this market decline.
**Now, all eyes are on Bitcoin.**
BTC has bounced from $62,006 and is trading near $65,000, but the recovery is not confirmed yet.
$62,000 is the key support buyers must defend. On the upside, $67,750 is the major resistance Bitcoin needs to reclaim.
If buyers hold support and build momentum, another move toward $67,750 could be on the table. But losing $62,000 could open the door to further downside.
This market is testing confidence, liquidity, and patience.
The real question is simple: Is this a healthy correction before recovery, or is Bitcoin preparing for another leg down?
I'm watching $62,000 very closely. No need to rush into a trade before confirmation.
$BTC
#BitcoinExtendsLosingStreakToSixWeeks #HuangReportedlyConsidersReturnToNvidia

2
1
2.4k
·
--
Bearish
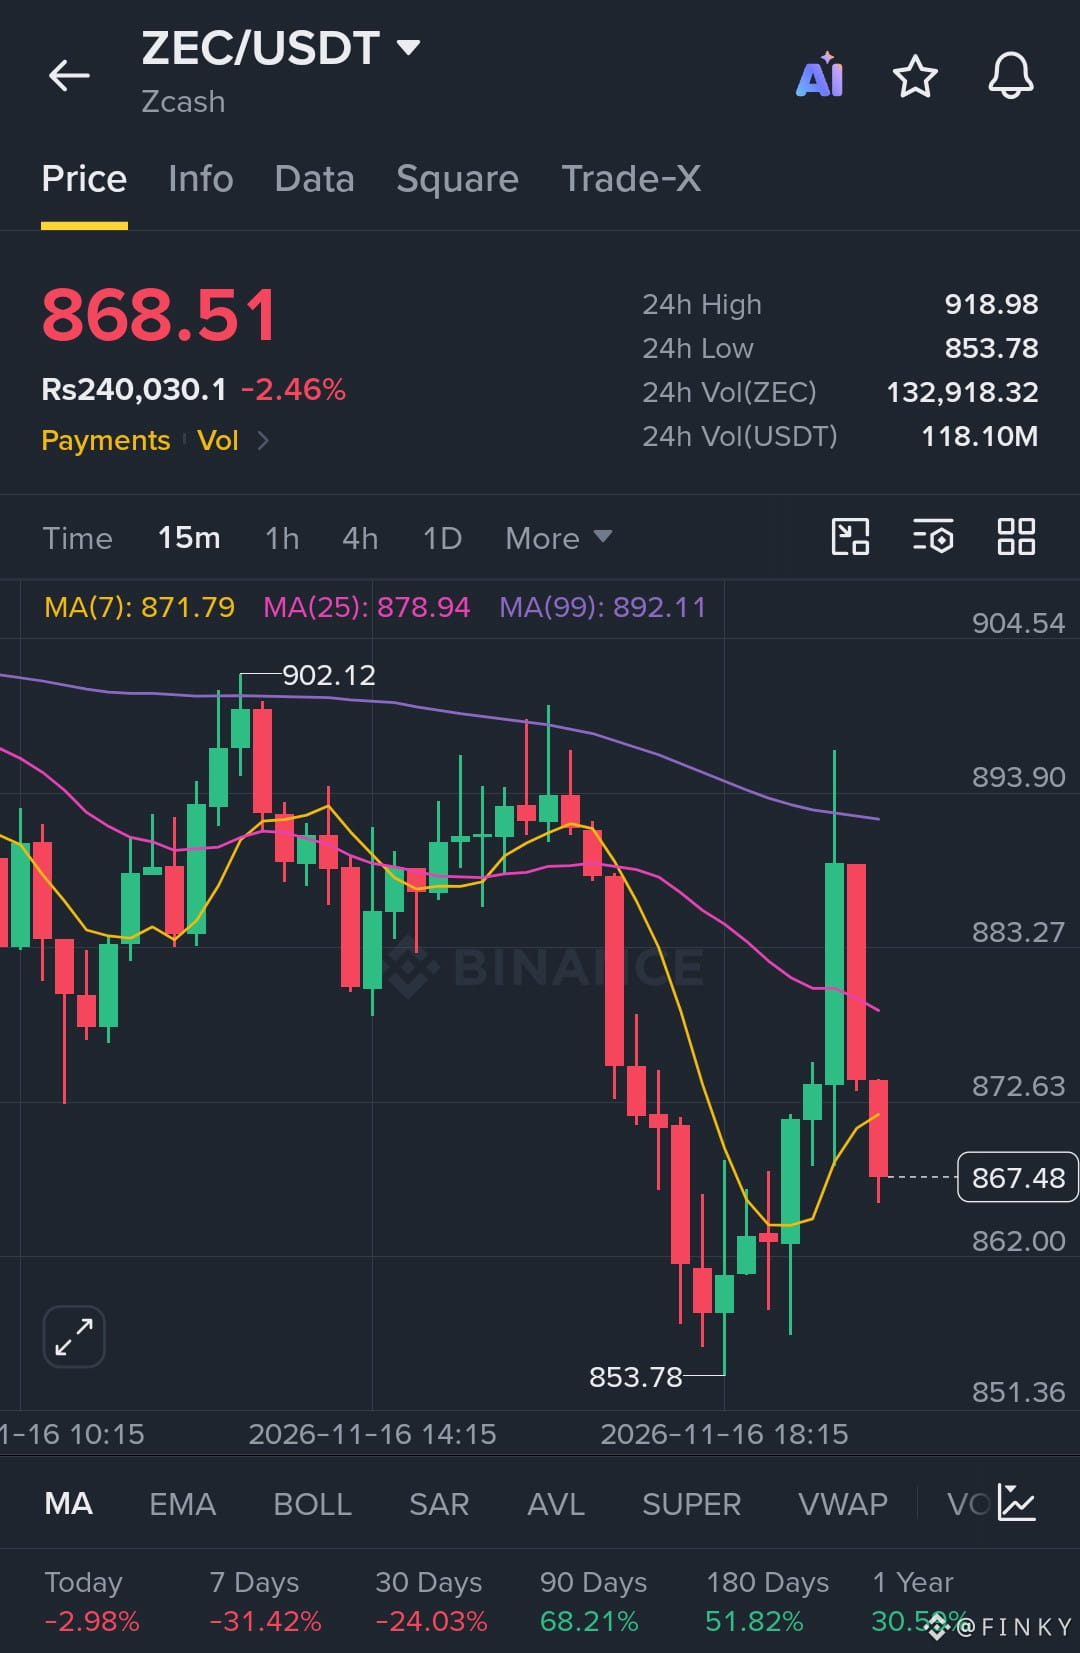
$ZEC is fighting to recover, but sellers are not giving up easily.
Zcash is trading around $868.51 after a sharp drop toward $853.78. Buyers stepped in and pushed the price back toward $888, but the latest rejection shows that selling pressure is still present.
Here’s what I'm watching:
Key Resistance: $872.63 – $878.94
Major Resistance: $892.11 – $902.12
Immediate Support: $862.00
Major Support: $853.78
The 15-minute chart shows ZEC trading below all three moving averages:
- MA(7): $871.79
- MA(25): $878.94
- MA(99): $892.11
This tells me the short-term structure is still under pressure. The recent bounce is encouraging, but buyers need to reclaim $879 and then break $892 to build a stronger recovery.
If $853.78 fails, another downside move could follow. On the other hand, a clean breakout above $892 could open the door toward $902 and potentially higher.
The bigger picture deserves caution: ZEC is down 31.42% over 7 days and 24.03% over 30 days, despite its strong 90-day performance.
I'm not chasing this bounce. I want to see buyers reclaim resistance with conviction before calling a trend reversal.
One level matters most right now: Can ZEC defend $853.78 and turn this recovery into a real comeback?
{spot}(ZECUSDT)
#AnthropicIPOTestsInvestorAppetiteForAI #BitcoinExtendsLosingStreakToSixWeeks #HuangReportedlyConsidersReturnToNvidia #SP500AndNasdaqFuturesHitQuarterlyLows #MUFGSMFGMizuhoPlanYenBackedStablecoin
$ZEC is fighting to recover, but sellers are not giving up easily.
Zcash is trading around $868.51 after a sharp drop toward $853.78. Buyers stepped in and pushed the price back toward $888, but the latest rejection shows that selling pressure is still present.
Here’s what I'm watching:
Key Resistance: $872.63 – $878.94
Major Resistance: $892.11 – $902.12
Immediate Support: $862.00
Major Support: $853.78
The 15-minute chart shows ZEC trading below all three moving averages:
- MA(7): $871.79
- MA(25): $878.94
- MA(99): $892.11
This tells me the short-term structure is still under pressure. The recent bounce is encouraging, but buyers need to reclaim $879 and then break $892 to build a stronger recovery.
If $853.78 fails, another downside move could follow. On the other hand, a clean breakout above $892 could open the door toward $902 and potentially higher.
The bigger picture deserves caution: ZEC is down 31.42% over 7 days and 24.03% over 30 days, despite its strong 90-day performance.
I'm not chasing this bounce. I want to see buyers reclaim resistance with conviction before calling a trend reversal.
One level matters most right now: Can ZEC defend $853.78 and turn this recovery into a real comeback?
#AnthropicIPOTestsInvestorAppetiteForAI #BitcoinExtendsLosingStreakToSixWeeks #HuangReportedlyConsidersReturnToNvidia #SP500AndNasdaqFuturesHitQuarterlyLows #MUFGSMFGMizuhoPlanYenBackedStablecoin
Zcash is trading around $868.51 after a sharp drop toward $853.78. Buyers stepped in and pushed the price back toward $888, but the latest rejection shows that selling pressure is still present.
Here’s what I'm watching:
Key Resistance: $872.63 – $878.94
Major Resistance: $892.11 – $902.12
Immediate Support: $862.00
Major Support: $853.78
The 15-minute chart shows ZEC trading below all three moving averages:
- MA(7): $871.79
- MA(25): $878.94
- MA(99): $892.11
This tells me the short-term structure is still under pressure. The recent bounce is encouraging, but buyers need to reclaim $879 and then break $892 to build a stronger recovery.
If $853.78 fails, another downside move could follow. On the other hand, a clean breakout above $892 could open the door toward $902 and potentially higher.
The bigger picture deserves caution: ZEC is down 31.42% over 7 days and 24.03% over 30 days, despite its strong 90-day performance.
I'm not chasing this bounce. I want to see buyers reclaim resistance with conviction before calling a trend reversal.
One level matters most right now: Can ZEC defend $853.78 and turn this recovery into a real comeback?
#AnthropicIPOTestsInvestorAppetiteForAI #BitcoinExtendsLosingStreakToSixWeeks #HuangReportedlyConsidersReturnToNvidia #SP500AndNasdaqFuturesHitQuarterlyLows #MUFGSMFGMizuhoPlanYenBackedStablecoin
187
·
--
Bullish
$BTC is finally showing some serious buying strength, but the next resistance could decide everything.
Bitcoin is trading around $65,174, following a powerful bullish candle on the 15-minute chart. Buyers pushed the price from the $64,300 area toward $65,696 before a small pullback.
Here’s what matters now:
Key Resistance: $65,391 – $65,696
Immediate Support: $64,997
Major Support Zone: $64,756 – $64,440
BTC is now trading above all three moving averages:
- MA(7): $64,601
- MA(25): $64,440
- MA(99): $64,756
That is an encouraging short-term signal. However, one strong candle doesn't confirm a full trend reversal.
If buyers reclaim $65,391 and break above $65,696, we could see another push higher. But if BTC loses $64,997, the price may return toward the moving average support zone.
The bigger picture still needs attention. BTC remains down 14.18% over 7 days and 19.68% over 30 days.
I'm watching the $65,696 level closely. A clean breakout with strong follow-through could change the short-term picture.
The real question is simple: Are buyers preparing for another leg up, or is this just a temporary relief bounce?
No chasing green candles. Let the market confirm its next move.
{spot}(BTCUSDT)
#AnthropicIPOTestsInvestorAppetiteForAI #MUFGSMFGMizuhoPlanYenBackedStablecoin #HuangReportedlyConsidersReturnToNvidia #CaliforniaVotersBackProp42BarringNewCryptoTaxes
$BTC is finally showing some serious buying strength, but the next resistance could decide everything.
Bitcoin is trading around $65,174, following a powerful bullish candle on the 15-minute chart. Buyers pushed the price from the $64,300 area toward $65,696 before a small pullback.
Here’s what matters now:
Key Resistance: $65,391 – $65,696
Immediate Support: $64,997
Major Support Zone: $64,756 – $64,440
BTC is now trading above all three moving averages:
- MA(7): $64,601
- MA(25): $64,440
- MA(99): $64,756
That is an encouraging short-term signal. However, one strong candle doesn't confirm a full trend reversal.
If buyers reclaim $65,391 and break above $65,696, we could see another push higher. But if BTC loses $64,997, the price may return toward the moving average support zone.
The bigger picture still needs attention. BTC remains down 14.18% over 7 days and 19.68% over 30 days.
I'm watching the $65,696 level closely. A clean breakout with strong follow-through could change the short-term picture.
The real question is simple: Are buyers preparing for another leg up, or is this just a temporary relief bounce?
No chasing green candles. Let the market confirm its next move.
#AnthropicIPOTestsInvestorAppetiteForAI #MUFGSMFGMizuhoPlanYenBackedStablecoin #HuangReportedlyConsidersReturnToNvidia #CaliforniaVotersBackProp42BarringNewCryptoTaxes
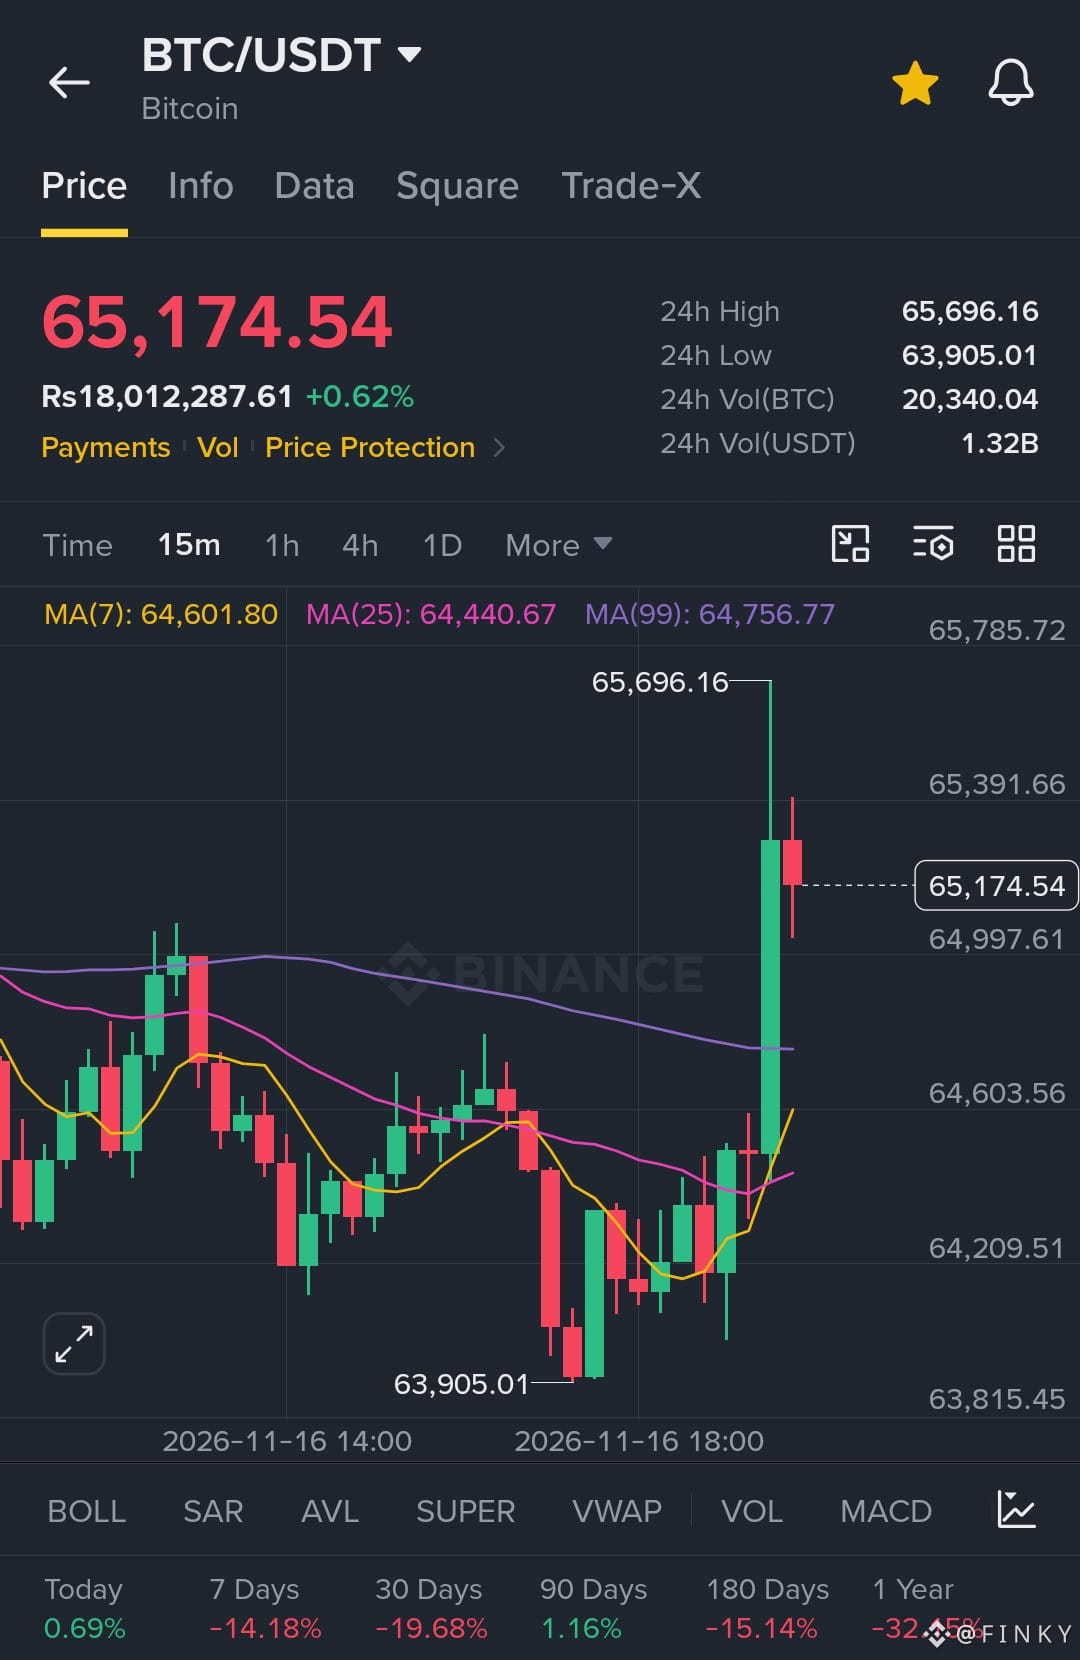
Bitcoin is trading around $65,174, following a powerful bullish candle on the 15-minute chart. Buyers pushed the price from the $64,300 area toward $65,696 before a small pullback.
Here’s what matters now:
Key Resistance: $65,391 – $65,696
Immediate Support: $64,997
Major Support Zone: $64,756 – $64,440
BTC is now trading above all three moving averages:
- MA(7): $64,601
- MA(25): $64,440
- MA(99): $64,756
That is an encouraging short-term signal. However, one strong candle doesn't confirm a full trend reversal.
If buyers reclaim $65,391 and break above $65,696, we could see another push higher. But if BTC loses $64,997, the price may return toward the moving average support zone.
The bigger picture still needs attention. BTC remains down 14.18% over 7 days and 19.68% over 30 days.
I'm watching the $65,696 level closely. A clean breakout with strong follow-through could change the short-term picture.
The real question is simple: Are buyers preparing for another leg up, or is this just a temporary relief bounce?
No chasing green candles. Let the market confirm its next move.
#AnthropicIPOTestsInvestorAppetiteForAI #MUFGSMFGMizuhoPlanYenBackedStablecoin #HuangReportedlyConsidersReturnToNvidia #CaliforniaVotersBackProp42BarringNewCryptoTaxes
180
·
--
Bullish
🔥 TOP 5 CRYPTO GAINERS TODAY!
The market is bringing some serious green moves!
Here are today's top five performers:
1. **$RARE (SuperRare):** +65.85%
2. **$GLMR (Moonbeam):** +24.82%
3. **$WIN (WINkLink):** +22.02%
4. **$FF (Falcon Finance):** +8.92%
5. **$TFUEL (Theta Fuel):** +8.88%
is leading the race with an impressive 65.85% gain, while $GLMR and are also showing strong momentum.
Happy Gainer Day! Green candles, strong moves, and exciting market action. 🔥
Which coin caught your attention today?
#AnthropicIPOTestsInvestorAppetiteForAI #HuangReportedlyConsidersReturnToNvidia #CryptoSelloffTriggersMultipleWhaleLiquidations #About64000BitcoinMiningMachinesReportedlyHijacked #BitcoinActiveSupplyInProfitDropsBelow45%
🔥 TOP 5 CRYPTO GAINERS TODAY!
The market is bringing some serious green moves!
Here are today's top five performers:
1. **$RARE (SuperRare):** +65.85%
2. **$GLMR (Moonbeam):** +24.82%
3. **$WIN (WINkLink):** +22.02%
4. **$FF (Falcon Finance):** +8.92%
5. **$TFUEL (Theta Fuel):** +8.88%
is leading the race with an impressive 65.85% gain, while $GLMR and are also showing strong momentum.
Happy Gainer Day! Green candles, strong moves, and exciting market action. 🔥
Which coin caught your attention today?
#AnthropicIPOTestsInvestorAppetiteForAI #HuangReportedlyConsidersReturnToNvidia #CryptoSelloffTriggersMultipleWhaleLiquidations #About64000BitcoinMiningMachinesReportedlyHijacked #BitcoinActiveSupplyInProfitDropsBelow45%
The market is bringing some serious green moves!
Here are today's top five performers:
1. **$RARE (SuperRare):** +65.85%
2. **$GLMR (Moonbeam):** +24.82%
3. **$WIN (WINkLink):** +22.02%
4. **$FF (Falcon Finance):** +8.92%
5. **$TFUEL (Theta Fuel):** +8.88%
is leading the race with an impressive 65.85% gain, while $GLMR and are also showing strong momentum.
Happy Gainer Day! Green candles, strong moves, and exciting market action. 🔥
Which coin caught your attention today?
#AnthropicIPOTestsInvestorAppetiteForAI #HuangReportedlyConsidersReturnToNvidia #CryptoSelloffTriggersMultipleWhaleLiquidations #About64000BitcoinMiningMachinesReportedlyHijacked #BitcoinActiveSupplyInProfitDropsBelow45%
253
·
--
Bearish
$WIN IS WAKING UP! BUYERS ARE BACK, AND THE NEXT BREAKOUT COULD BE HUGE!
$WIN/USDT is showing a strong recovery, currently trading around $0.00005533, up 21.87% in the last 24 hours. The price has bounced sharply from $0.00004416 and climbed toward $0.00005859 before entering a consolidation phase.
What catches my attention is the recovery structure. Buyers stepped in aggressively after the heavy decline, pushing price back above $0.00005296. Now WIN is holding around $0.00005500, trying to build a base for its next move.
My Trading Plan:
Entry Zone: $0.00005450 – $0.00005550
TP1: $0.00005614
TP2: $0.00005859
TP3: $0.00005932
SL: $0.00005280
Bullish Scenario:
If buyers defend $0.00005400 and push above $0.00005614, WIN could make another attempt toward $0.00005859. A clean breakout above that level could open the way toward $0.00005932.
What Could Go Wrong?
The recent rally is strong, but momentum still needs confirmation. Losing the $0.00005296 support would weaken the recovery and could bring $0.00004979 back into focus.
I don't want to chase the green candles. I want to see buyers defend support and confirm the breakout before expecting another expansion.
WIN has made its comeback. Now the real test is whether buyers can turn this recovery into a sustained uptrend.
Risk managed. Eyes on the targets.
Let's go $WIN
{spot}(WINUSDT)
#AnthropicIPOTestsInvestorAppetiteForAI #CryptoSelloffTriggersMultipleWhaleLiquidations #About64000BitcoinMiningMachinesReportedlyHijacked #USSpotXRPETFsSeeLargestWeeklyOutflowIn8Months #WillFOMCMinutesReinforceRateHikeExpectations?
$WIN IS WAKING UP! BUYERS ARE BACK, AND THE NEXT BREAKOUT COULD BE HUGE!
$WIN /USDT is showing a strong recovery, currently trading around $0.00005533, up 21.87% in the last 24 hours. The price has bounced sharply from $0.00004416 and climbed toward $0.00005859 before entering a consolidation phase.
What catches my attention is the recovery structure. Buyers stepped in aggressively after the heavy decline, pushing price back above $0.00005296. Now WIN is holding around $0.00005500, trying to build a base for its next move.
My Trading Plan:
Entry Zone: $0.00005450 – $0.00005550
TP1: $0.00005614
TP2: $0.00005859
TP3: $0.00005932
SL: $0.00005280
Bullish Scenario:
If buyers defend $0.00005400 and push above $0.00005614, WIN could make another attempt toward $0.00005859. A clean breakout above that level could open the way toward $0.00005932.
What Could Go Wrong?
The recent rally is strong, but momentum still needs confirmation. Losing the $0.00005296 support would weaken the recovery and could bring $0.00004979 back into focus.
I don't want to chase the green candles. I want to see buyers defend support and confirm the breakout before expecting another expansion.
WIN has made its comeback. Now the real test is whether buyers can turn this recovery into a sustained uptrend.
Risk managed. Eyes on the targets.
Let's go $WIN
#AnthropicIPOTestsInvestorAppetiteForAI #CryptoSelloffTriggersMultipleWhaleLiquidations #About64000BitcoinMiningMachinesReportedlyHijacked #USSpotXRPETFsSeeLargestWeeklyOutflowIn8Months #WillFOMCMinutesReinforceRateHikeExpectations?
$WIN /USDT is showing a strong recovery, currently trading around $0.00005533, up 21.87% in the last 24 hours. The price has bounced sharply from $0.00004416 and climbed toward $0.00005859 before entering a consolidation phase.
What catches my attention is the recovery structure. Buyers stepped in aggressively after the heavy decline, pushing price back above $0.00005296. Now WIN is holding around $0.00005500, trying to build a base for its next move.
My Trading Plan:
Entry Zone: $0.00005450 – $0.00005550
TP1: $0.00005614
TP2: $0.00005859
TP3: $0.00005932
SL: $0.00005280
Bullish Scenario:
If buyers defend $0.00005400 and push above $0.00005614, WIN could make another attempt toward $0.00005859. A clean breakout above that level could open the way toward $0.00005932.
What Could Go Wrong?
The recent rally is strong, but momentum still needs confirmation. Losing the $0.00005296 support would weaken the recovery and could bring $0.00004979 back into focus.
I don't want to chase the green candles. I want to see buyers defend support and confirm the breakout before expecting another expansion.
WIN has made its comeback. Now the real test is whether buyers can turn this recovery into a sustained uptrend.
Risk managed. Eyes on the targets.
Let's go $WIN
#AnthropicIPOTestsInvestorAppetiteForAI #CryptoSelloffTriggersMultipleWhaleLiquidations #About64000BitcoinMiningMachinesReportedlyHijacked #USSpotXRPETFsSeeLargestWeeklyOutflowIn8Months #WillFOMCMinutesReinforceRateHikeExpectations?
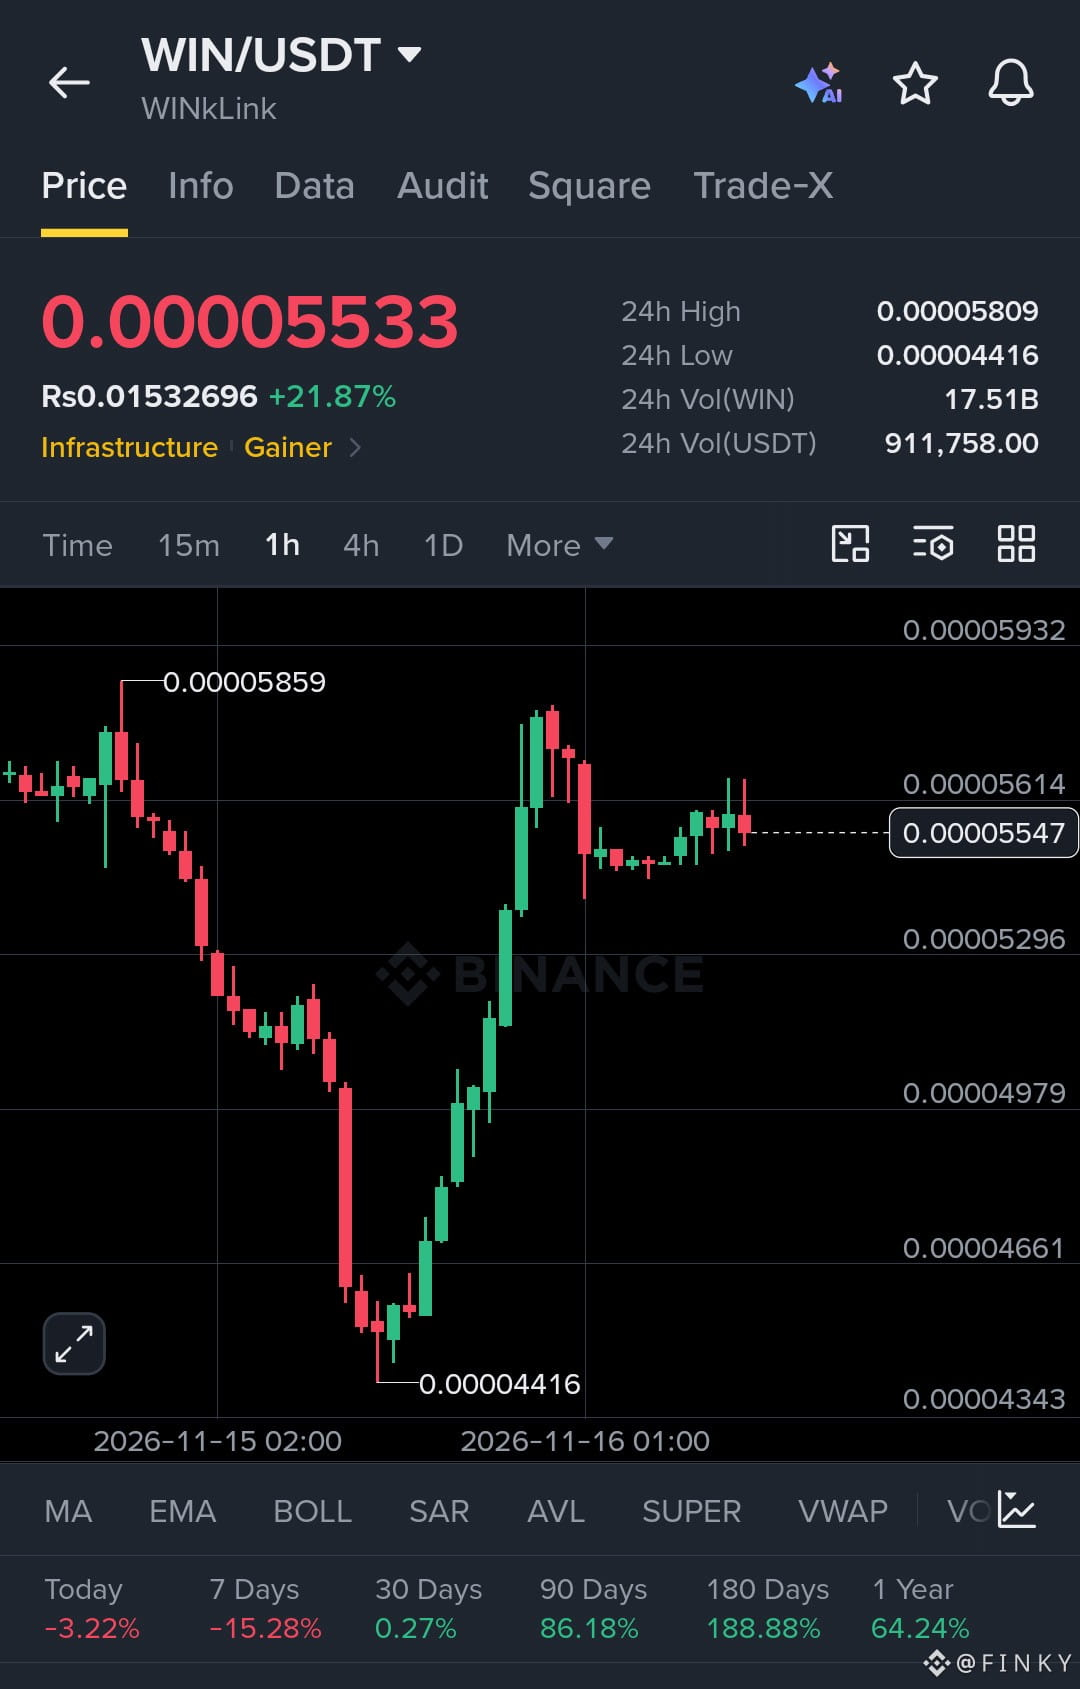
1
1
268
Log in to explore more content
Join global crypto users on Binance Square
⚡️ Get latest and useful information about crypto.
💬 Trusted by the world’s largest crypto exchange.
👍 Discover real insights from verified creators.
Email / Phone number
Trending Topics
NvidiaEarningsTonight:AIStocks’NextMove?
62,826 views
906 Discussing
Nvidia Earnings Day: Interim CEO's First Appearance — Can the AI Story Hold?
Binance News
·17 Likes
·7.9k views
A Packed Week of Earnings and Data Tests Markets
122,110 views
613 Discussing
AnthropicIPOTestsInvestorAppetiteForAI
269,180 views
2,621 Discussing