
Hyperliquid is back on the radar. But while the market debates its potential, the charts show a structure that calls for caution. Are we looking at a SHORT opportunity or a recovery taking shape?
HYPE has an interesting mix: real economic activity, infrastructure expansion, new integrations, and, at the same time, regulatory pressure and technical weakness.
Let’s analyze where the best trading opportunities may emerge.
🔴 1. The news that could change the outlook
On November 18, the Hong Kong Securities and Futures Commission (SFC) added Hyperliquid to its list of suspicious platforms.
The warning states that the platform is not authorized by the SFC and may be offering or promoting trading services in Hong Kong without the appropriate license.
This does NOT mean that Hyperliquid has been declared fraudulent or that its operations are prohibited worldwide.
However, it introduces regulatory risk that the market cannot ignore.
The initial reaction was negative, although HYPE managed to recover some of its losses. This raises a question: are buyers absorbing the pressure, or are we just seeing a bounce within a weakening trend?
📊 2. Fundamentals: there's more behind HYPE
Hyperliquid is not just a speculative token.
Its perpetual contract trading infrastructure records considerable economic activity.
According to DefiLlama, as of November 19:
TVL: approximately US$7.295 billion.
Fees over the last 30 days: US$95.32 million.
Protocol revenue: US$72.65 million.
Market capitalization: approximately US$16.261 billion.
But one figure deserves attention: TVL fell 12.1% over the last 30 days.
This means that although economic activity remains significant, there are also signs of a decline in deposited capital.
Another interesting aspect is the Assistance Fund mechanism, which uses protocol revenue to buy HYPE on the market. According to documentation filed with the SEC, the mechanism allocates approximately 99% of the fees to these buybacks.
This could be a positive factor for demand for the token, although it does not guarantee a price increase.
⚡ 3. An integration that could expand its market
On November 19, 1inch announced the integration of Hyperliquid's perpetual markets into its Android app and wallet.
This provides access to cryptocurrency, stock, commodity, and foreign exchange markets through Hyperliquid's infrastructure.
Why does it matter?
Because it makes Hyperliquid's markets easier to access from another DeFi ecosystem and could expand its distribution.
But we need to distinguish between two things: easier access does not automatically mean higher volume or greater demand for HYPE.
The catalyst is there. Its economic impact still needs to be demonstrated.
🧨 4. DERIVATIVES: where is liquidity positioned?
Derivatives can provide very useful information for anticipating short-term moves.
In the data collected on November 19, we found:
Open interest on Hyperliquid: approximately US$1.3 billion.
24-hour futures volume: approximately US$454 million.
Annualized funding rate on Hyperliquid: negative, close to -2.8%.
Positioning by value on Hyperliquid: slightly skewed toward shorts.
One important detail: funding is not the same across all platforms. Binance and Hyperliquid showed different conditions.
What does this mean for trading?
Negative funding may indicate that shorts are paying longs. If the price starts to rise and sellers are poorly positioned, a short squeeze could occur.
But be careful: negative funding does not mean that the price necessarily has to rise.
The interesting signal would be a price recovery accompanied by rising open interest and sustained buying.
📉 5. TECHNICAL ANALYSIS: the levels that really matter
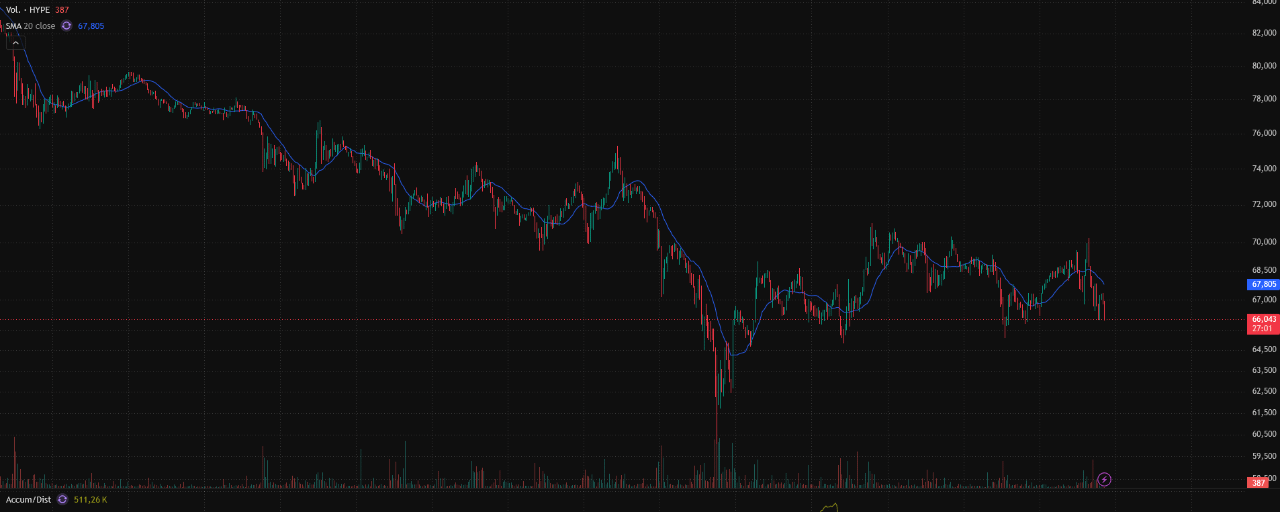
In the shared HYPE/USDT chart, we see a 30-minute structure with a downward trend from approximately US$82.
The price in the screenshot was US$66.043, while the SMA 20 was at US$67.805.
There are three important elements:
The price remains below its moving average.
Attempts to recover toward US$69–70 encountered selling pressure.
After recovering from US$62–63, the market lost momentum again.
The takeaway is clear: we still don't have a confirmed bullish reversal.
On the daily chart, the indicators also reflect weakness. The reported RSI was around 39.5, while the four-hour analysis showed a more neutral outlook.
Levels to watch:
LevelImportanceUS$70.50Nearby major resistanceUS$69–68Recovery zoneUS$67.80SMA 20 on your chartUS$66Reference price in the screenshotUS$64.30Key supportUS$62.40Second supportUS$60.40Lower support
These levels should be confirmed by candle closes and volume.
🎯 6. TRADES: three scenarios worth preparing for
This is the most important part of the analysis.
SCENARIO A — SHORT: look for a bearish continuation
The first opportunity I would watch for is a bounce toward US$67.80–69 that fails to consolidate.
Conditions:
Weak recovery toward resistance.
Confirmed rejection on the 30-minute or 1-hour chart.
Rising selling volume.
Failure to reclaim the SMA 20.
Potential targets:
US$66.
US$64.30.
US$62.40.
Invalidation: sustained recovery of the resistance zone and formation of higher highs.
SCENARIO B — LONG: capitalize on a recovery
I wouldn't buy just because HYPE has fallen.
I would wait for a recovery above US$67.80 and, especially, a confirmed breakout above US$70.50.
Conditions:
A 4-hour close above resistance.
Rising buying volume.
RSI confirming the move.
Open interest increasing without excessive deterioration in funding.
Potential targets:
US$72.30.
US$74.60.
US$75.50.
Invalidation: loss of the recovered zone and a return below resistance.
SCENARIO C — SHORT ON A SUPPORT BREAKDOWN
If HYPE loses US$64.30 on a convincing close and then fails to reclaim that level, another bearish opportunity could emerge.
Targets:
US$62.40.
US$60.40.
US$56.90 if the pressure continues.
The key would be to avoid selling directly into support: a breakdown followed by a failed retest offers more compelling confirmation.
🧠 7. My conclusion: which trade makes the most sense?
Currently, HYPE has a weakened technical structure, but its fundamentals still point to an infrastructure with significant activity.
The regulatory news adds uncertainty, while the integration with 1inch opens up the possibility of expansion.
My trading bias is cautious and slightly bearish until resistance levels are reclaimed.
The trade I would watch most closely is a SHORT if a bounce is rejected, without ruling out a LONG if a confirmed breakout above US$70.50 occurs.
There's no need to jump the gun: the best trades tend to emerge when the market confirms a thesis.
What would I watch over the next 24–72 hours?
Recovery or rejection at US$67.80.
Reaction at US$70.50.
Break below US$64.30.
Changes in Open Interest and Funding.
Changes in buying and selling volume.
HYPE has the potential to make interesting moves, but right now confirmation is more valuable than anticipation.
Are you looking for a LONG on HYPE, or do you think it still has further downside?