
Be careful with $BTC right now!
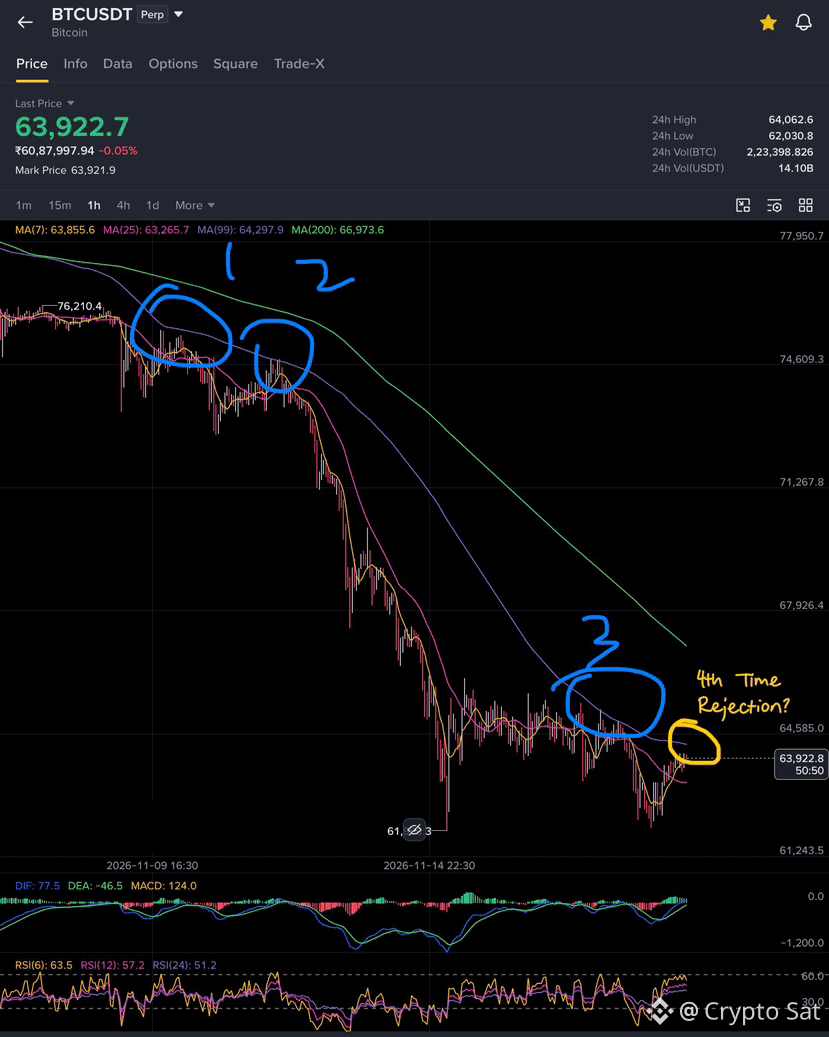
Bitcoin is approaching one of the most crucial resistance levels on the 1H chart — MA99, currently sitting around $64,300.
Look at the chart carefully, guys!
On November 5th, Bitcoin lost its MA99 support around $78,000, and since then, this moving average has been acting as strong resistance.
Price has already faced rejection around this MA more than 3 times, and now we’re approaching it again!
Will history repeat for the 4th time?
Currently BTC is trading around $63,922, and the next few hourly candles could be very important.
If buyers fail to reclaim MA99 around $64,300, I expect another rejection toward $63,300, followed by $62,000 if selling pressure increases.
As long as Bitcoin stays below MA99, the broader 1H bearish structure remains intact.
What are indicators telling us?
MACD is showing bullish momentum, with positive histogram bars and a bullish crossover.
RSI(6) is around 63.5, while RSI(12) and RSI(24) are at 57.2 and 51.2. Buyers are recovering, but that doesn’t confirm a breakout yet.
Here’s the interesting part!
If Bitcoin breaks above $64,300 and sustains above MA99 with strong buying volume, we could see a recovery toward $65,000–$66,000 in the coming hours.
Don’t get trapped by a temporary breakout or a sudden green candle.
Bitcoin is approaching one of the most crucial resistance levels on the 1H chart — MA99, currently sitting around $64,300.
Look at the chart carefully, guys!
On November 5th, Bitcoin lost its MA99 support around $78,000, and since then, this moving average has been acting as strong resistance.
Price has already faced rejection around this MA more than 3 times, and now we’re approaching it again!
Will history repeat for the 4th time?
Currently BTC is trading around $63,922, and the next few hourly candles could be very important.
If buyers fail to reclaim MA99 around $64,300, I expect another rejection toward $63,300, followed by $62,000 if selling pressure increases.
As long as Bitcoin stays below MA99, the broader 1H bearish structure remains intact.
What are indicators telling us?
MACD is showing bullish momentum, with positive histogram bars and a bullish crossover.
RSI(6) is around 63.5, while RSI(12) and RSI(24) are at 57.2 and 51.2. Buyers are recovering, but that doesn’t confirm a breakout yet.
Here’s the interesting part!
If Bitcoin breaks above $64,300 and sustains above MA99 with strong buying volume, we could see a recovery toward $65,000–$66,000 in the coming hours.
Don’t get trapped by a temporary breakout or a sudden green candle.