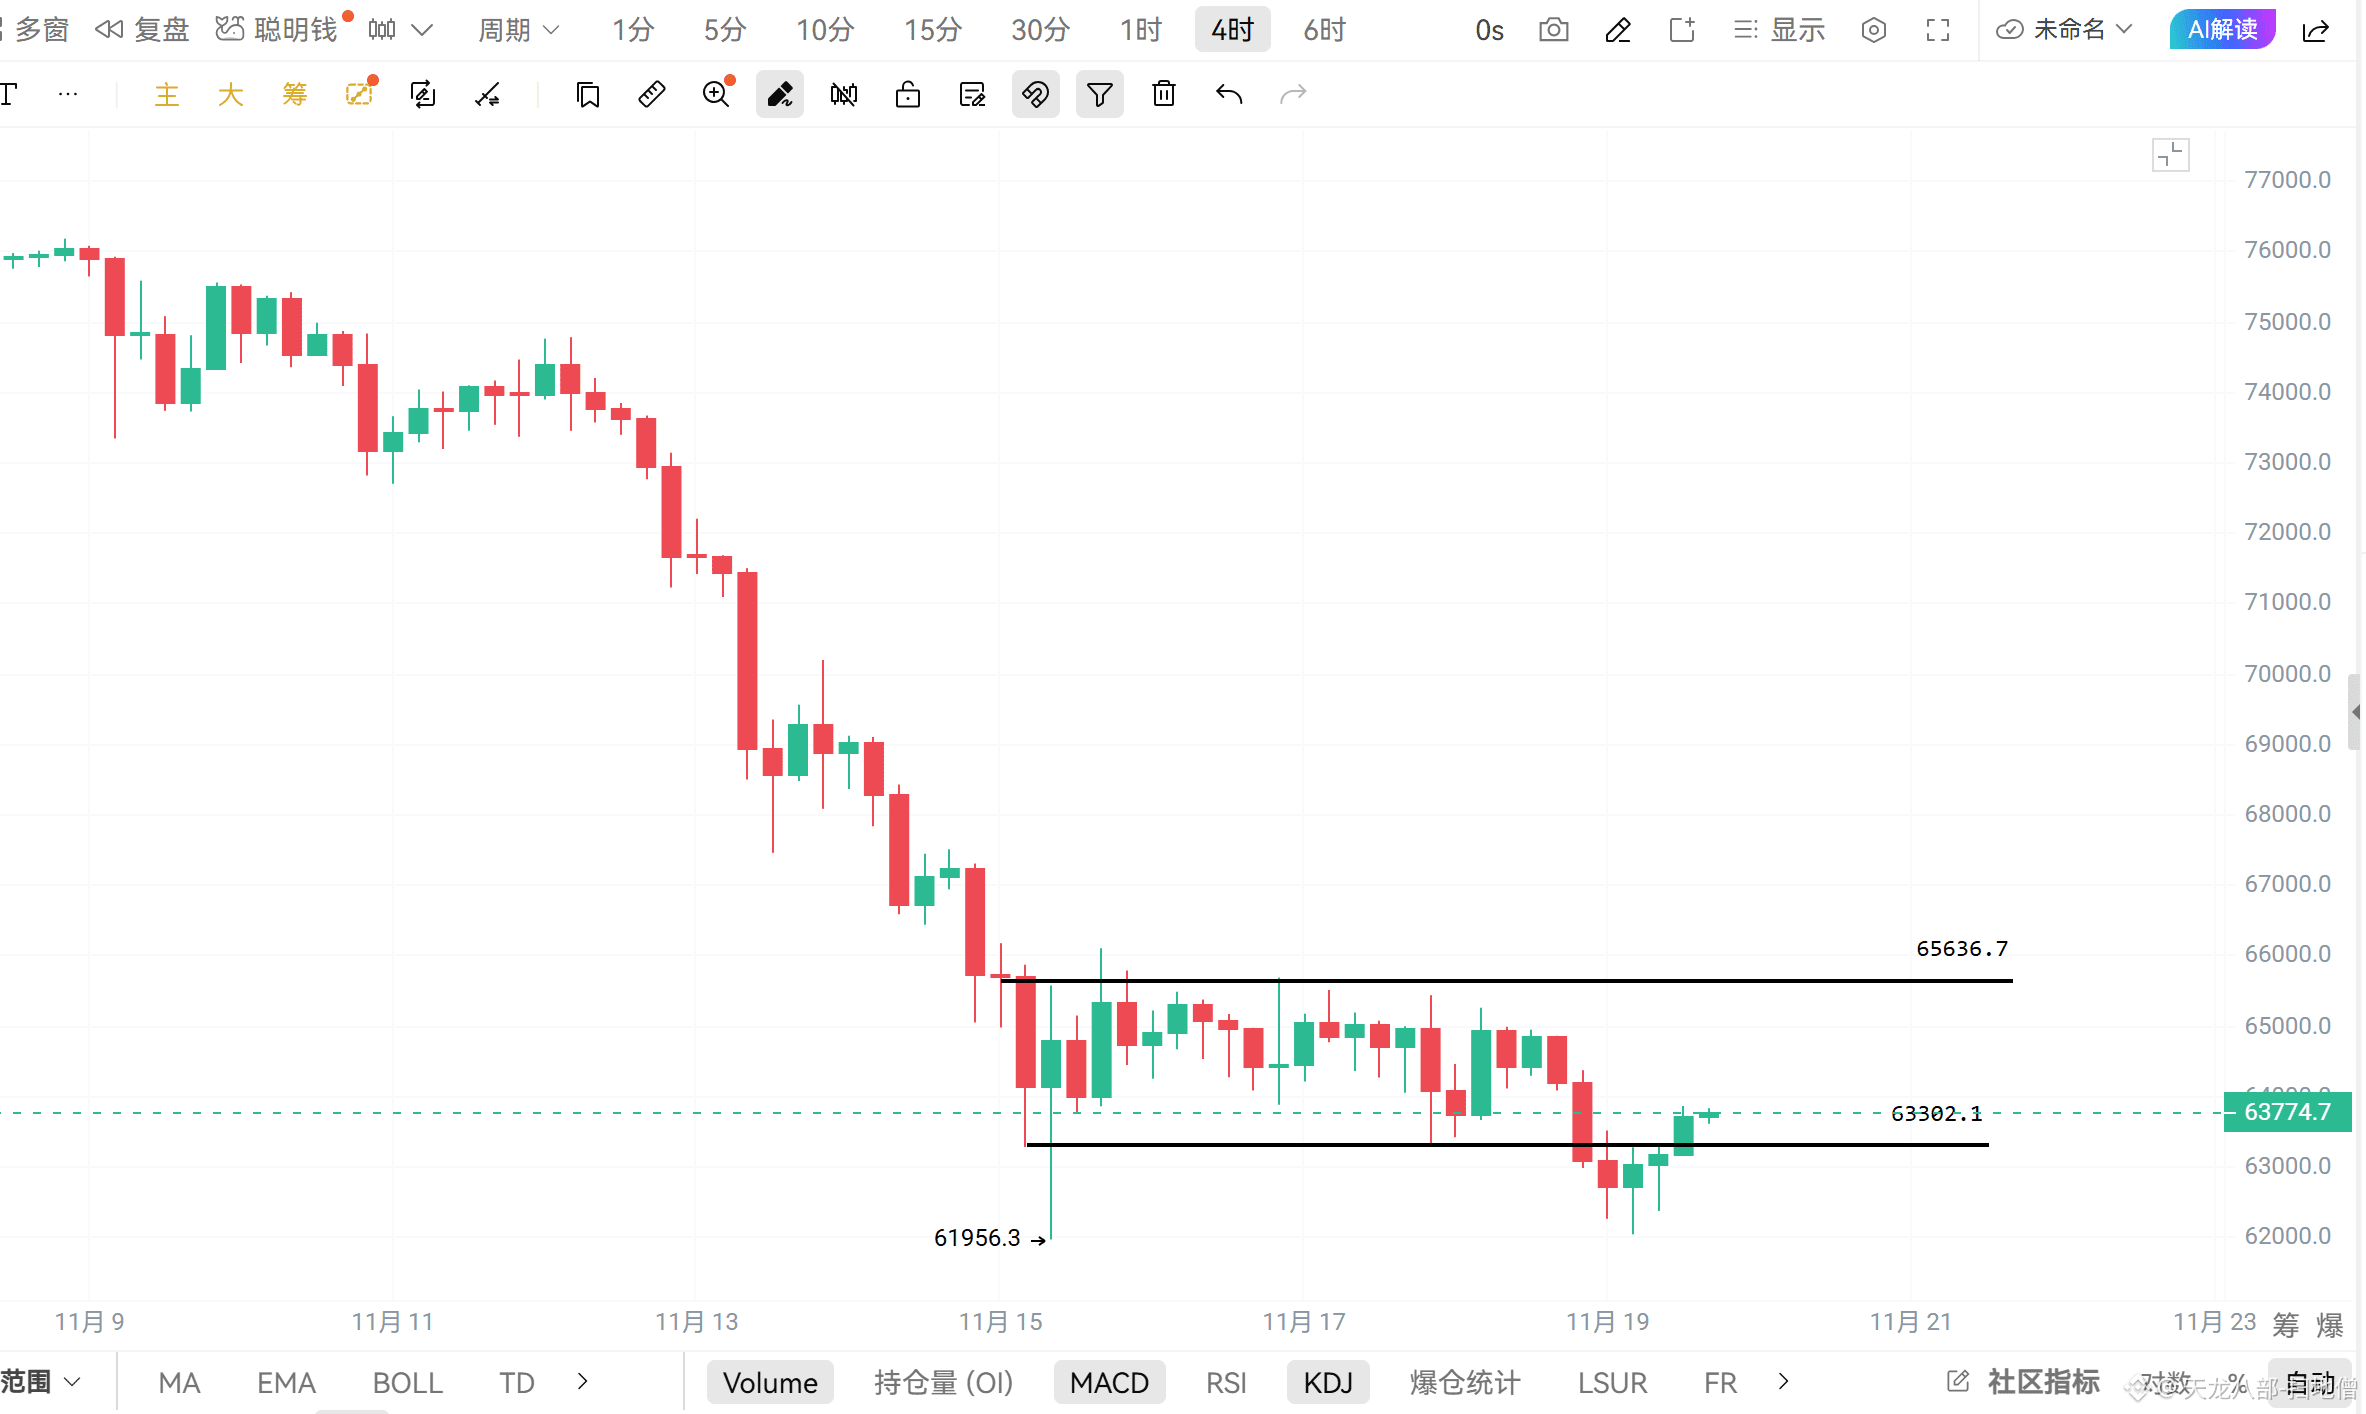
$BTC From last night's market action, you can see that although the market appears to be falling, it has not broken the low of 91900. As for whether it will continue to fluctuate and decline later, or pull up again to the 65400-66100 area and then continue to fluctuate, slowly forming a base by moving the bottom upward, we need to analyze and anticipate step by step based on subsequent market trends and indicators.
The difference between around 63000 and 62000 is only 1,000 points. To say that after this fluctuation the market will continue to fall, I think that is a bit too deliberate. First, if the market retraced to around 63850, and if a large-scale harvest were intended, then the upward pull during yesterday's U.S. stock market opening was right around here. 63850 could completely let these shorts unwind together. Last night, the area around 62100 showed liquidation strength, which may have been some players who held on from 70k or even higher until they were close to forced liquidation, or players with heavy positions yesterday. Others could not be harvested.
What is now in front of us is whether this 64500 point can break through and hold. Once it holds, the impact of yesterday's decline is equivalent to zero. From medium- and long-term indicators, the market has a probability of moving upward. But now it is also not feasible to analyze and predict the market trend using medium- and long-term indicators, because grinding consolidation can change everything, and this kind of thing happens frequently this year.
For the current market, do not analyze or predict the trend three days from now; just look at today's and tomorrow's trend. Especially for swing trading, do not look far ahead. Similar to last night's market, from the 1-hour and 4-hour indicators, it could not fall. The only uncertainty was the size of the retracement. But after the retracement and rebound, combine short-term indicators and ultra-short-term indicators with candlesticks to look step by step. A retracement from 62260 to a high of 63550, and from 63000 to a high of 63860 is a resistance area. Right now the market is stuck near 83850. Is this a good shorting opportunity? I think that remains to be discussed. Of course, if you want to take a position near 83850, adding a 200-300 point stop as a safeguard for a painless or insignificant forecast is also fine. After all, the middle-to-upper band of the 1-hour Bollinger Bands is still moving down. In any case, the bears still need to let their momentum pass downward first. So for now, either high-level range-bound consolidation with a delayed decline, or a decline itself. There is no big issue with shorting. But from an indicator perspective, the short-term MACD has collectively formed a golden cross and broken above the zero axis. Once the market, through range-bound consolidation and delayed decline, slowly releases the bearish structure that short-term indicators are showing, and then forms a bullish structure, it can basically be confirmed that it will rise further. Therefore, if you are shorting, you need to watch the chart closely and sell in time if the indicators start to look wrong.
Personally, I still recommend waiting and watching the market until it reaches around 64500 before making a decision.
The difference between around 63000 and 62000 is only 1,000 points. To say that after this fluctuation the market will continue to fall, I think that is a bit too deliberate. First, if the market retraced to around 63850, and if a large-scale harvest were intended, then the upward pull during yesterday's U.S. stock market opening was right around here. 63850 could completely let these shorts unwind together. Last night, the area around 62100 showed liquidation strength, which may have been some players who held on from 70k or even higher until they were close to forced liquidation, or players with heavy positions yesterday. Others could not be harvested.
What is now in front of us is whether this 64500 point can break through and hold. Once it holds, the impact of yesterday's decline is equivalent to zero. From medium- and long-term indicators, the market has a probability of moving upward. But now it is also not feasible to analyze and predict the market trend using medium- and long-term indicators, because grinding consolidation can change everything, and this kind of thing happens frequently this year.
For the current market, do not analyze or predict the trend three days from now; just look at today's and tomorrow's trend. Especially for swing trading, do not look far ahead. Similar to last night's market, from the 1-hour and 4-hour indicators, it could not fall. The only uncertainty was the size of the retracement. But after the retracement and rebound, combine short-term indicators and ultra-short-term indicators with candlesticks to look step by step. A retracement from 62260 to a high of 63550, and from 63000 to a high of 63860 is a resistance area. Right now the market is stuck near 83850. Is this a good shorting opportunity? I think that remains to be discussed. Of course, if you want to take a position near 83850, adding a 200-300 point stop as a safeguard for a painless or insignificant forecast is also fine. After all, the middle-to-upper band of the 1-hour Bollinger Bands is still moving down. In any case, the bears still need to let their momentum pass downward first. So for now, either high-level range-bound consolidation with a delayed decline, or a decline itself. There is no big issue with shorting. But from an indicator perspective, the short-term MACD has collectively formed a golden cross and broken above the zero axis. Once the market, through range-bound consolidation and delayed decline, slowly releases the bearish structure that short-term indicators are showing, and then forms a bullish structure, it can basically be confirmed that it will rise further. Therefore, if you are shorting, you need to watch the chart closely and sell in time if the indicators start to look wrong.
Personally, I still recommend waiting and watching the market until it reaches around 64500 before making a decision.