Bitcoin is back at the doorstep of $62,000. Today’s candle will determine whether this is a rebound or the start of another leg down.
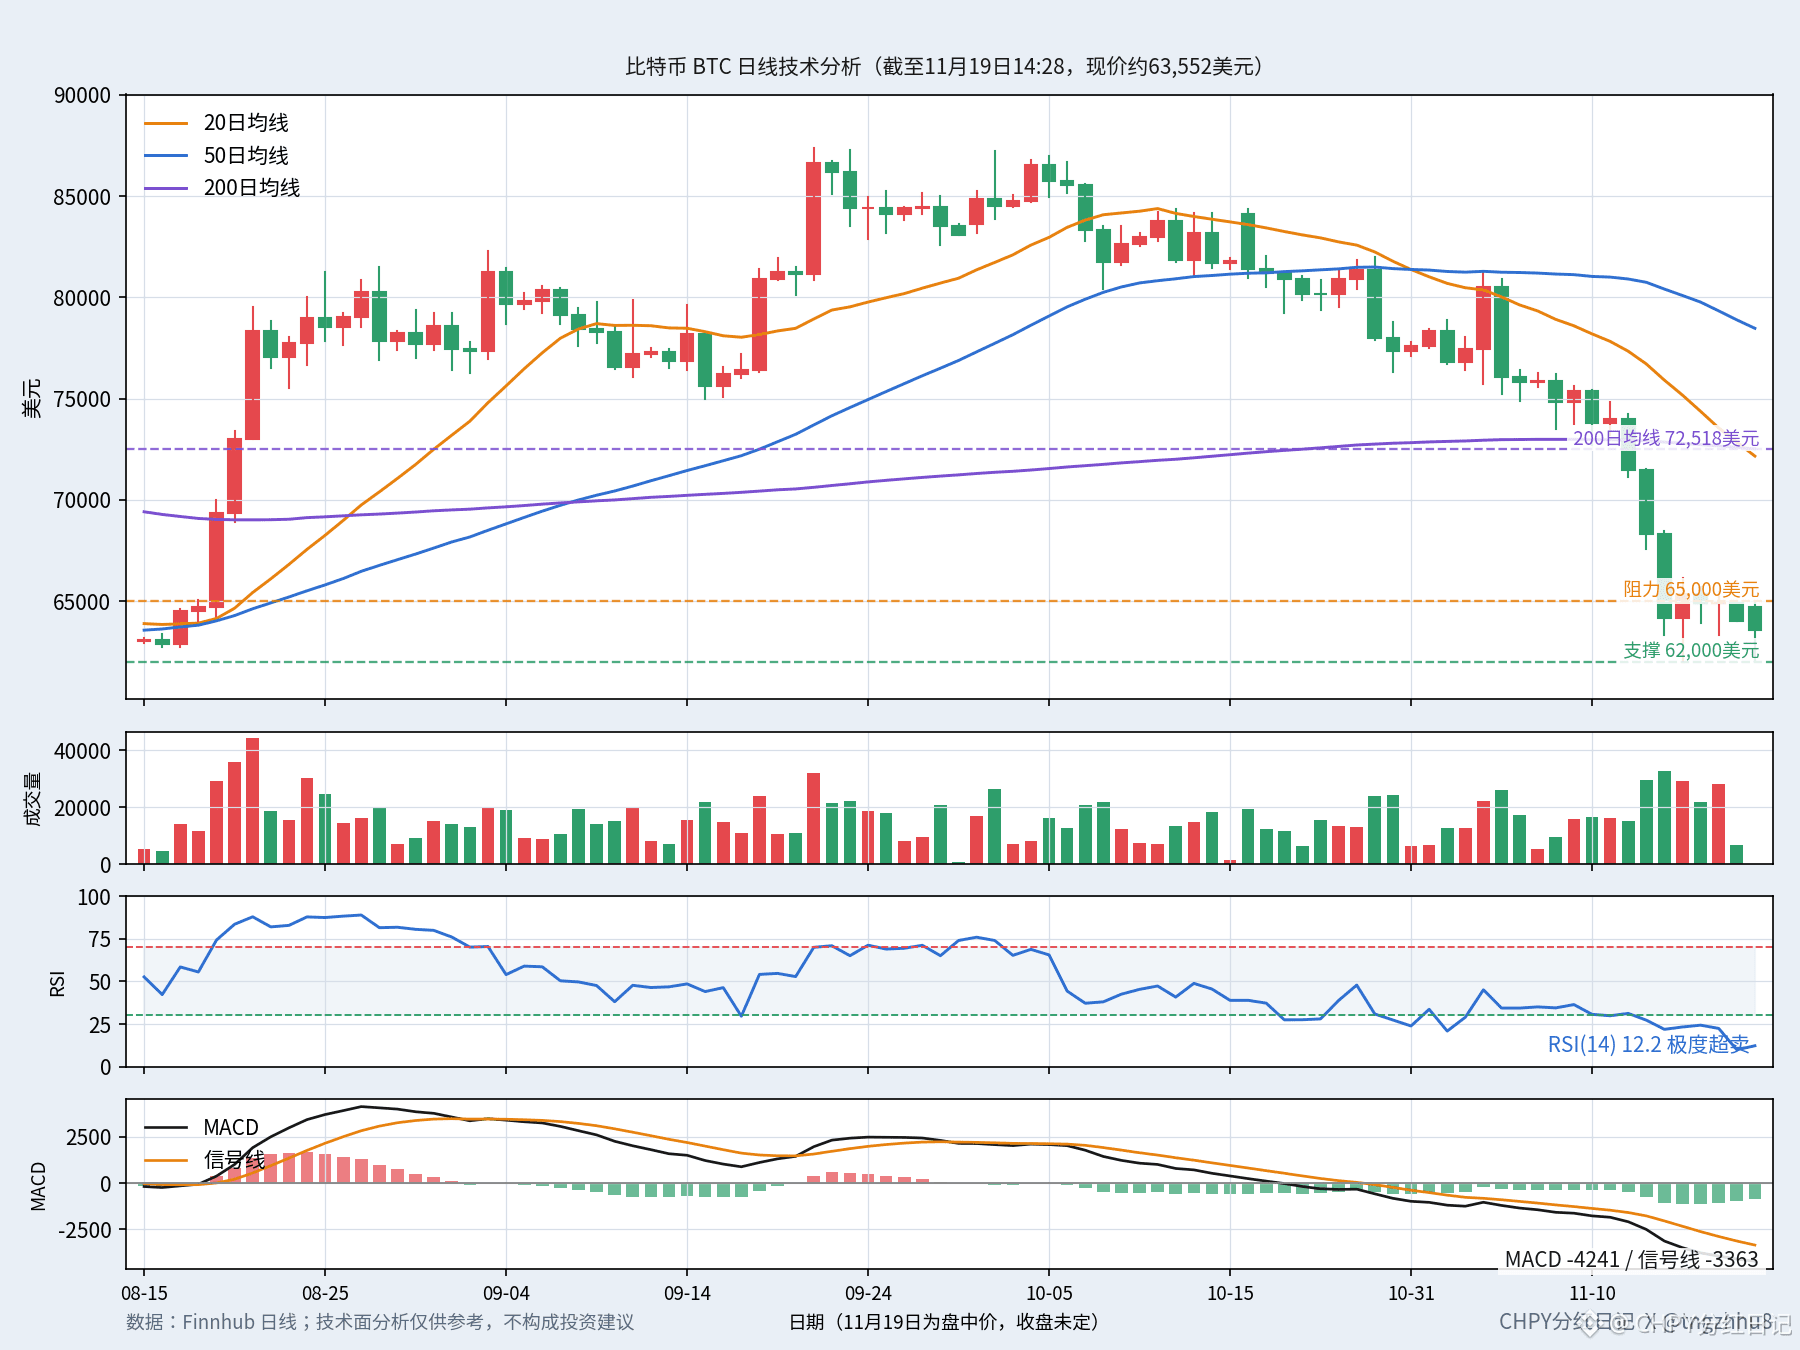
As of 14:28 Beijing time, Bitcoin was around $63,552. It opened today at $64,692, reached an intraday high of $64,953, and fell as low as $62,063—less than $100 away from $62,000. Bitcoin closed at $64,024 on November 18, down 1.42% for the day. From its November 12 close of $71,460, it has fallen about 11% in seven days and about 22% in 30 days. It is down roughly 27% from its October high of about $87,100, and has been cut in half from its October 2025 all-time high of $126,198.
All three technical indicators are in extreme territory. The Relative Strength Index (RSI) is just 12.2, after closing at 9.9 yesterday. This indicator measures buying and selling momentum: below 30 is considered oversold, while a single-digit reading indicates that bears have been steamrolling the market and bulls have barely fought back. The MACD (a trend-strength indicator) is at -4,241, with a signal line of -3,363 and a histogram of -878. Although the histogram has narrowed slightly from -979 the previous day, it remains well below the zero line. The decline has merely slowed; there is no sign yet of a bullish reversal. Moving averages (the average cost over a period of time) are all overhead: the 20-day average is $72,161, the 50-day is $78,472, and the 200-day is $72,518. The current price is 12% below the 200-day average and 19% below the 50-day average. The 20-day average has crossed below the 200-day average, confirming a bearish alignment.
The news is also weighing on prices. The Fed’s October meeting minutes were hawkish, with almost all officials agreeing that further rate hikes may be needed; the probability of a December hike is above 95%. November saw net outflows of about $2.2 billion from spot Bitcoin exchange-traded funds. The Crypto Fear & Greed Index is at 10 and has remained in extreme fear for seven consecutive days. However, buyers have not disappeared entirely: on-chain data shows that around 66,000 Bitcoin were absorbed in the $62,000–$66,000 range over the past two days.
Watch two levels. First, on the upside, $65,000: reclaiming it would be the first sign that the decline has been halted. Beyond that is the $66,000–$68,000 area, where the 200-week moving average, at around $68,000, is acting as resistance. The 200-day moving average at $72,518 is the key medium-term dividing line between bulls and bears; it is too early to talk about a reversal until that level is reclaimed. On the downside, $62,000 is being tested for the second time this week. Bitcoin held above it on both occasions—the November 15 low was $62,006, and today’s low was $62,063. If it holds, there is still room for a discussion. If the daily candle closes below $62,000, the next levels to watch are the $60,000 psychological mark and then the June low of $58,500.
Oversold conditions can spark a rebound, but being oversold is not in itself a reason to buy. If $62,000 holds, it may be a bottom; if it fails, that could mark the start of the next leg down.
#比特币 #TechnicalAnalysis
$BTC $ETH $SOL
As of 14:28 Beijing time, Bitcoin was around $63,552. It opened today at $64,692, reached an intraday high of $64,953, and fell as low as $62,063—less than $100 away from $62,000. Bitcoin closed at $64,024 on November 18, down 1.42% for the day. From its November 12 close of $71,460, it has fallen about 11% in seven days and about 22% in 30 days. It is down roughly 27% from its October high of about $87,100, and has been cut in half from its October 2025 all-time high of $126,198.
All three technical indicators are in extreme territory. The Relative Strength Index (RSI) is just 12.2, after closing at 9.9 yesterday. This indicator measures buying and selling momentum: below 30 is considered oversold, while a single-digit reading indicates that bears have been steamrolling the market and bulls have barely fought back. The MACD (a trend-strength indicator) is at -4,241, with a signal line of -3,363 and a histogram of -878. Although the histogram has narrowed slightly from -979 the previous day, it remains well below the zero line. The decline has merely slowed; there is no sign yet of a bullish reversal. Moving averages (the average cost over a period of time) are all overhead: the 20-day average is $72,161, the 50-day is $78,472, and the 200-day is $72,518. The current price is 12% below the 200-day average and 19% below the 50-day average. The 20-day average has crossed below the 200-day average, confirming a bearish alignment.
The news is also weighing on prices. The Fed’s October meeting minutes were hawkish, with almost all officials agreeing that further rate hikes may be needed; the probability of a December hike is above 95%. November saw net outflows of about $2.2 billion from spot Bitcoin exchange-traded funds. The Crypto Fear & Greed Index is at 10 and has remained in extreme fear for seven consecutive days. However, buyers have not disappeared entirely: on-chain data shows that around 66,000 Bitcoin were absorbed in the $62,000–$66,000 range over the past two days.
Watch two levels. First, on the upside, $65,000: reclaiming it would be the first sign that the decline has been halted. Beyond that is the $66,000–$68,000 area, where the 200-week moving average, at around $68,000, is acting as resistance. The 200-day moving average at $72,518 is the key medium-term dividing line between bulls and bears; it is too early to talk about a reversal until that level is reclaimed. On the downside, $62,000 is being tested for the second time this week. Bitcoin held above it on both occasions—the November 15 low was $62,006, and today’s low was $62,063. If it holds, there is still room for a discussion. If the daily candle closes below $62,000, the next levels to watch are the $60,000 psychological mark and then the June low of $58,500.
Oversold conditions can spark a rebound, but being oversold is not in itself a reason to buy. If $62,000 holds, it may be a bottom; if it fails, that could mark the start of the next leg down.
#比特币 #TechnicalAnalysis
$BTC $ETH $SOL