Why go short and then long?
Let’s look at the reasoning:
$BTC
Price action over the past couple of days has largely followed the plan.
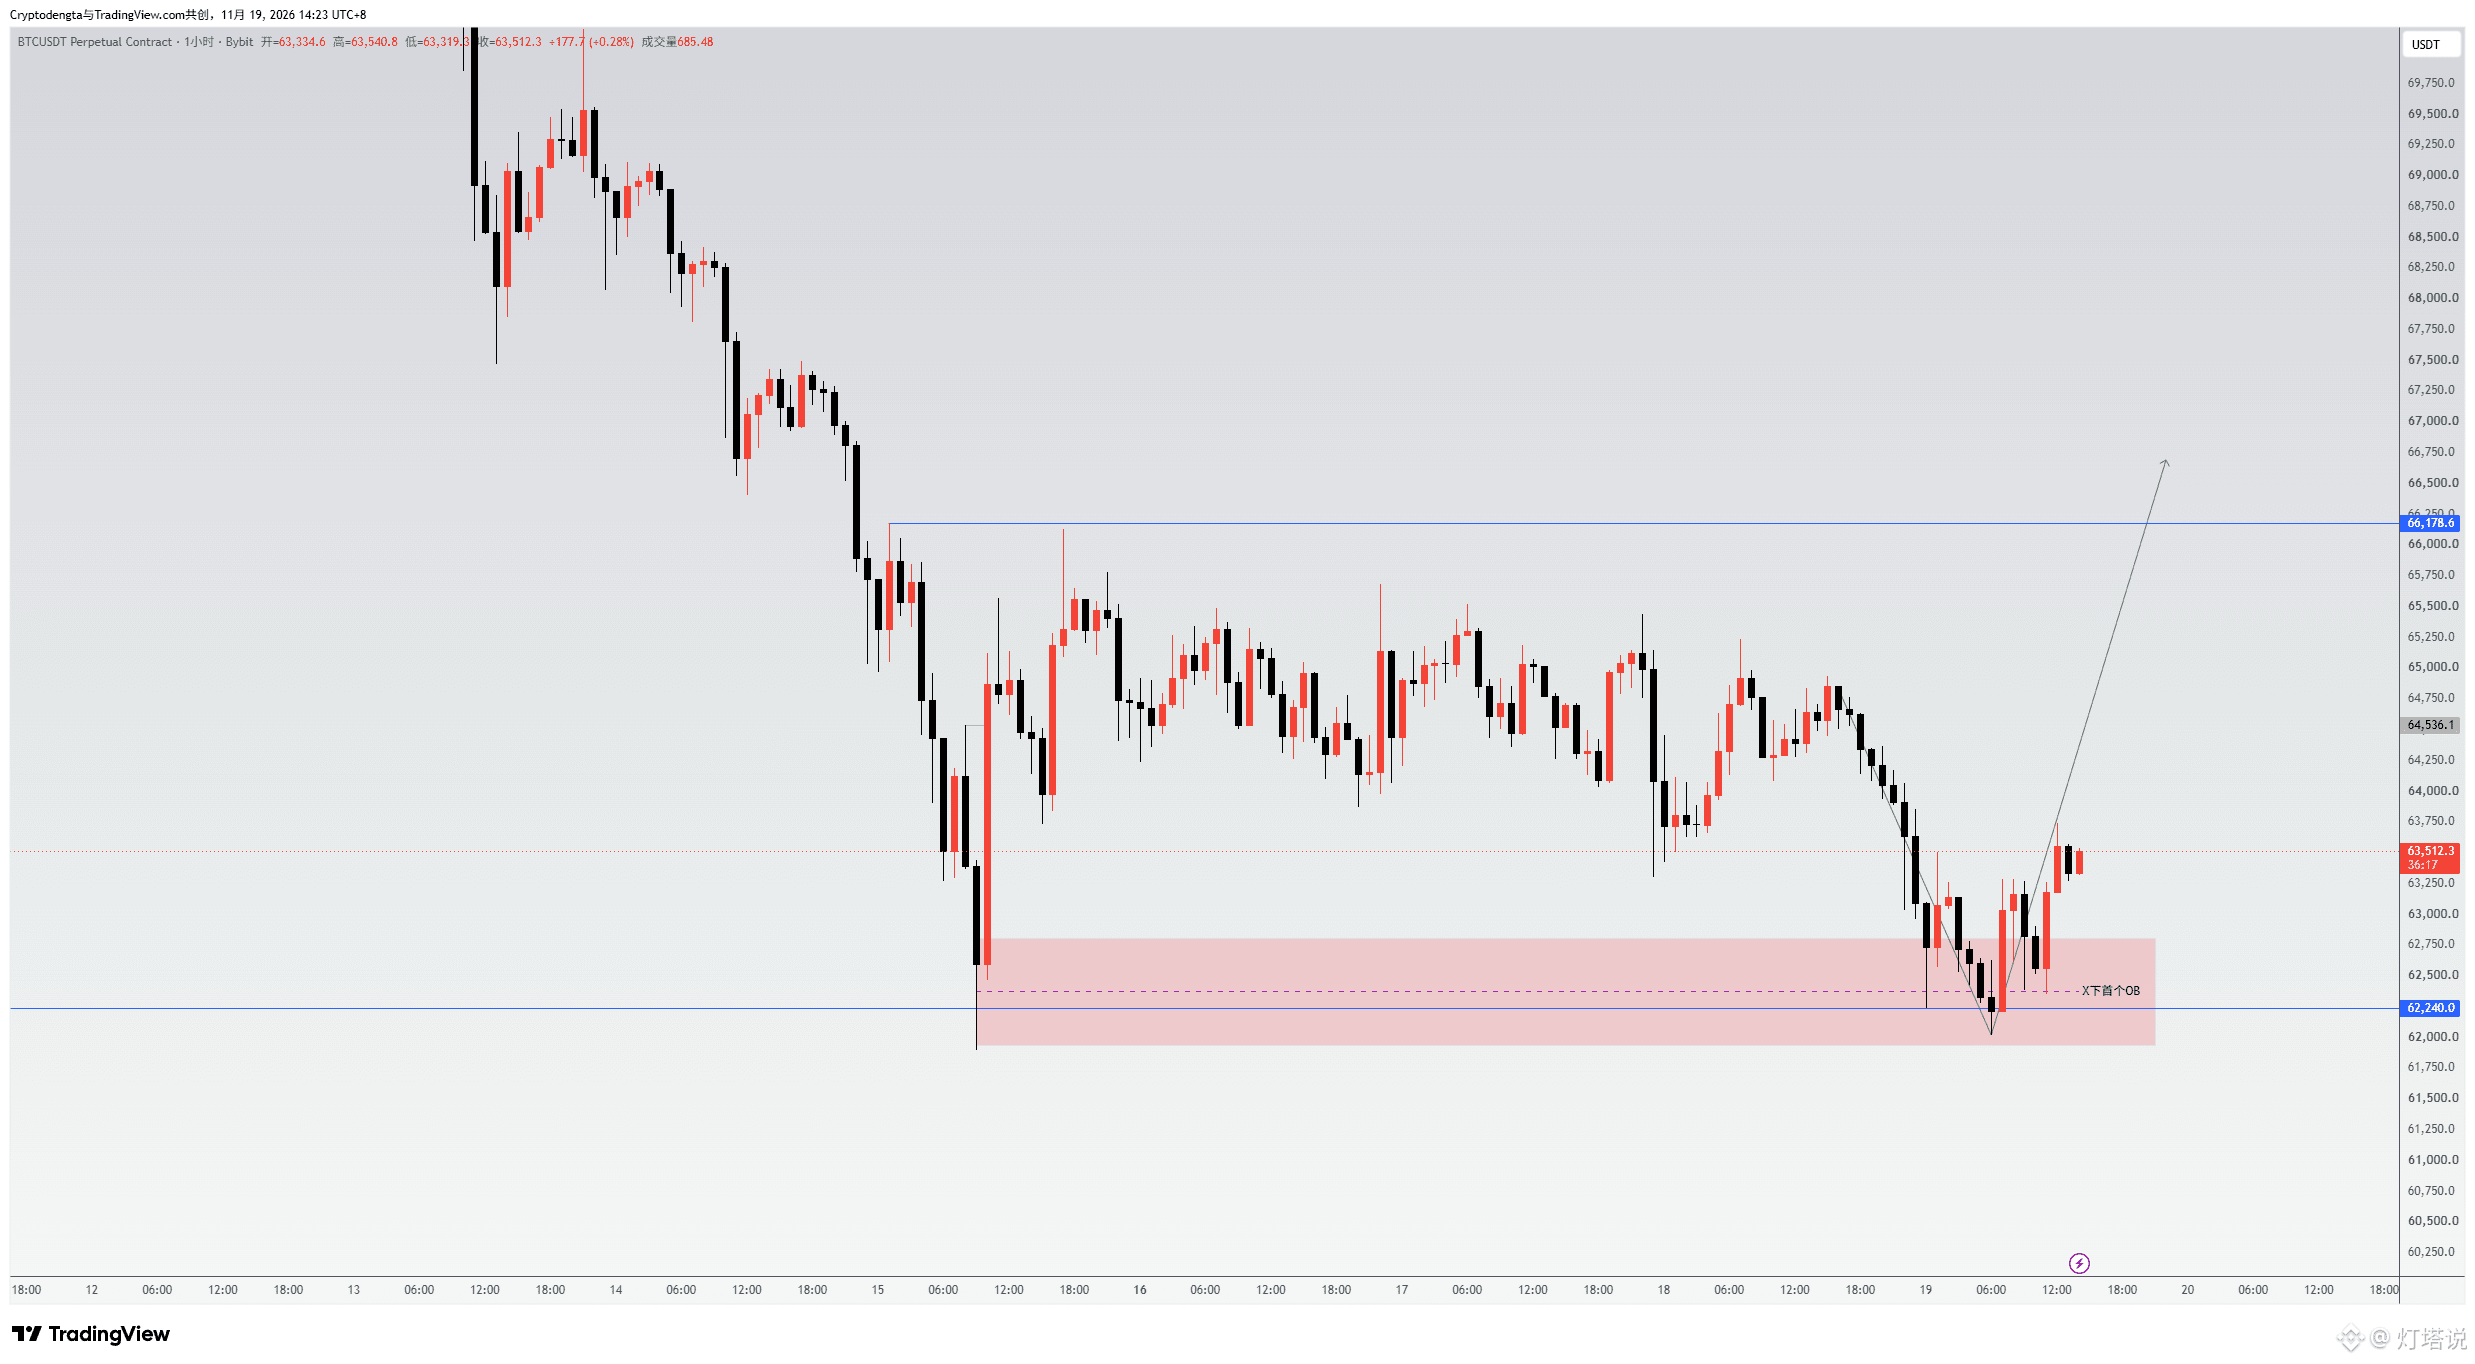
After surging on high volume through the previous 62K low late last week, the price rebounded.
It swept the liquidity below and then broke through the hourly candle’s IDM.
After breaking below 63,700,
price rebounded again from the extreme OB zone at 62K (commonly called a second-bottom retest of 62K).
Structurally, this looks a lot like a bottoming rebound.
That’s a very good sign,
but it’s still unclear how strong the rebound will be.
The next resistance overhead is still around 66,200; only a break above that level would open the way to 68–70K.
But after the daily rebound, price is still falling. That’s the trend!
Liquidity is drying up, and market fluctuations take time.
I’ve been patiently waiting with my position open.
Let’s look at the reasoning:
$BTC
Price action over the past couple of days has largely followed the plan.
After surging on high volume through the previous 62K low late last week, the price rebounded.
It swept the liquidity below and then broke through the hourly candle’s IDM.
After breaking below 63,700,
price rebounded again from the extreme OB zone at 62K (commonly called a second-bottom retest of 62K).
Structurally, this looks a lot like a bottoming rebound.
That’s a very good sign,
but it’s still unclear how strong the rebound will be.
The next resistance overhead is still around 66,200; only a break above that level would open the way to 68–70K.
But after the daily rebound, price is still falling. That’s the trend!
Liquidity is drying up, and market fluctuations take time.
I’ve been patiently waiting with my position open.