



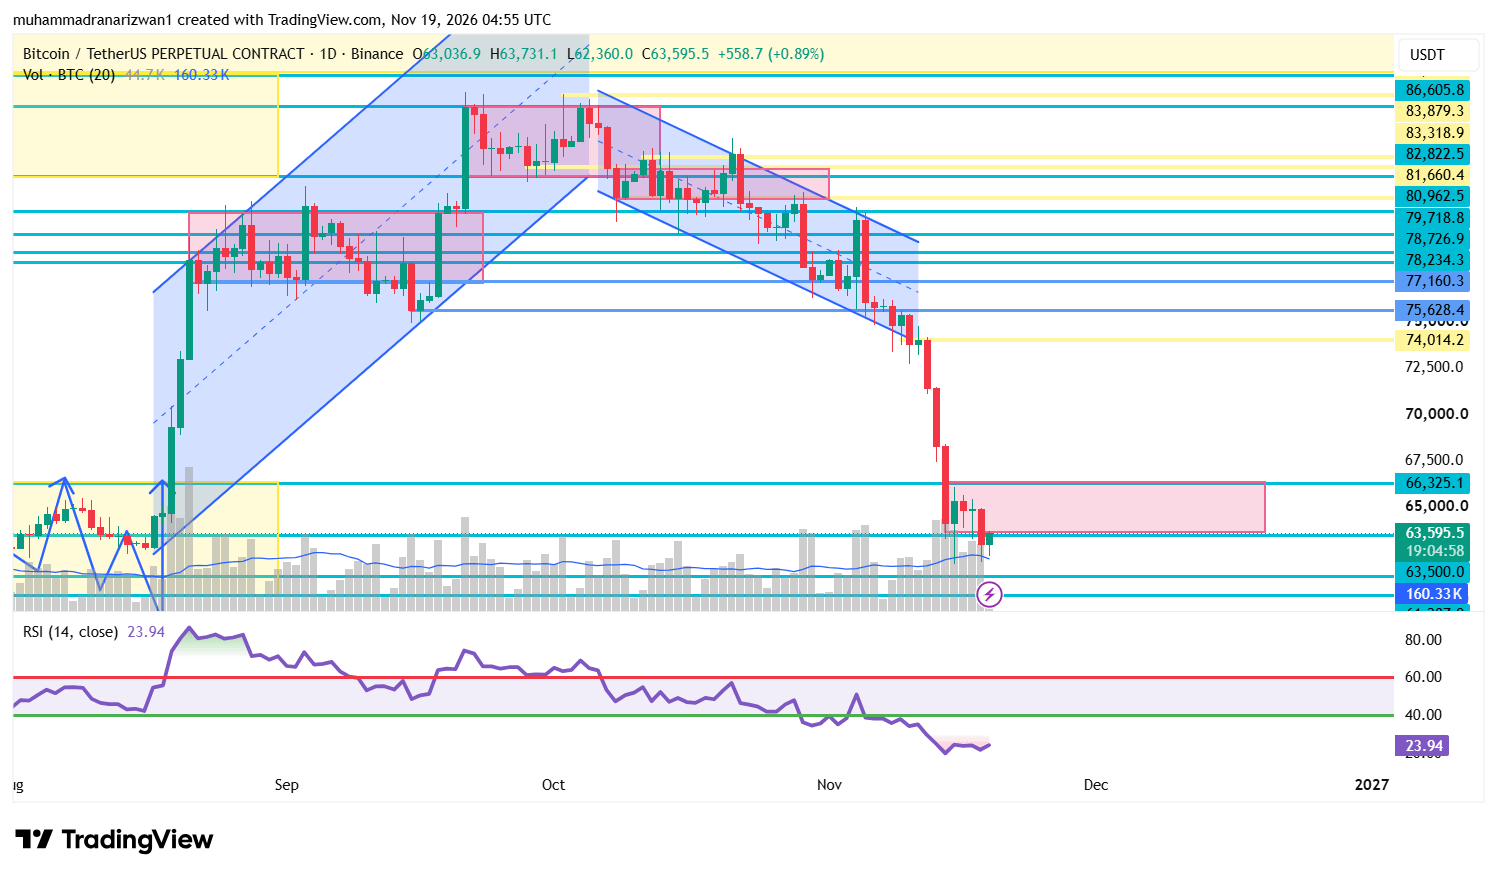
Bitcoin is facing a critical battle between buyers and sellers after experiencing a massive breakdown from the $74,000–$75,000 region. BTC is currently trading around $63,595, and the daily chart suggests that the market remains under significant bearish pressure.
However, there is an important question traders should consider:
Are we preparing for another major downside move, or is Bitcoin approaching a short-term relief rally?
Let's break down the technical structure, market sentiment, liquidity, and possible trading opportunities.
1. Bitcoin Technical Analysis – Daily Chart
Bitcoin has broken below its previous rising structure and subsequently lost the descending channel's support.
The recent sell-off has been aggressive, with several strong bearish daily candles pushing BTC from the $74K region toward $63K.
Currently, price is approaching an important demand and reaction zone around $63,500–$66,325.
This region could become the first major battleground between buyers and sellers.
Important observation:
The previous bullish structure has been invalidated.
Sellers remain in control of the daily trend.
BTC is trading below major previous support zones.
A recovery without reclaiming resistance should be treated as a potential relief rally rather than a confirmed trend reversal.
2. Important Support & Resistance Levels
Traders should closely monitor the following levels:
Major Resistance Levels:
$66,325 – Immediate resistance and recovery confirmation level.
$68,000 – Important psychological and technical resistance.
$70,000 – Major recovery target.
$74,014 – Previous breakdown region.
$75,628 – Higher resistance zone.
Major Support Levels:
$63,500 – Immediate price reaction area.
$61,907 – Important downside liquidity reference.
$60,500 – Psychological support zone.
$58,000–$59,000 – Potential deeper downside region if selling pressure accelerates.
A sustained daily close above $66,325 would improve the recovery outlook.
On the other hand, a decisive breakdown below $63,500 could expose BTC to another downside move.$XRP
3. RSI Analysis – Is Bitcoin Oversold?
One of the most interesting signals on the daily chart is the RSI.
Current Daily RSI: 23.94
This is deeply oversold territory.
Historically, extremely low RSI readings can increase the possibility of:
Short-term relief rallies.
Bearish momentum exhaustion.
Short-covering activity.
Volatile price reversals.
However, traders must understand that an oversold RSI does not automatically mean Bitcoin has reached its bottom.
During strong bearish trends, RSI can remain oversold for an extended period.
Therefore, confirmation through price action is essential.$BNB
4. Market Sentiment & Institutional Activity
The broader market dashboard also provides important information.
Key observations from today's market
Crypto Market Capitalization: Approximately $2.16 Trillion.
Crypto Fear & Greed Index: 10.
US Stock Fear & Greed Index: 25.
Crypto Average RSI: 41.04.
US Spot BTC ETF Daily Net Flow: -$157.76 Million.
Bitcoin Treasury Weekly Net Inflow: +$51.86 Million.
BTC Open Interest: 663.68K BTC.
BTC Funding Rate: 0.0038%.
The extremely low Fear & Greed reading indicates significant fear across the market.
ETF net outflows suggest institutional demand remains a concern, although Bitcoin treasury inflows provide a relatively positive counterpoint.
The funding rate is close to neutral, suggesting that the derivatives market is not showing an extreme positive funding imbalance.
Overall, market sentiment remains weak.
5. Bitcoin Liquidity & Liquidation Analysis
According to the dashboard's liquidation data, two important liquidity reference levels are:
$63,796 – Long-side liquidation reference.
$61,906 – Short-side liquidation reference.
These levels should be monitored carefully as BTC approaches them.
A move toward nearby liquidity can trigger volatility and forced position closures.
Traders should avoid entering positions simply because price approaches a liquidation level. Wait for confirmation through candle structure and volume.
6. What Could Be Bitcoin's Next Move?
There are two major scenarios to watch.
🔴 Scenario 1: Bearish Continuation
This remains the primary scenario because the daily market structure is bearish.
If Bitcoin fails to reclaim $66,325 and sellers regain control below $63,500, the next potential downside targets are:
$61,907
$60,500
$58,000–$59,000
A daily close below $63,500, followed by a failed retest, would strengthen the bearish outlook.
🟢 Scenario 2: Short-Term Bullish Recovery
Despite the bearish trend, the daily RSI is deeply oversold.
If buyers defend the current support area and BTC successfully reclaims $66,325, a recovery could develop.
Potential upside targets:
$68,000
$70,000
$74,014
However, a move above $66,325 alone does not confirm a complete bullish reversal. Strong volume and sustained price acceptance are necessary.
7. TRADE SIGNAL – BTCUSDT
Overall Market Bias: BEARISH
Trading Strategy: Wait for confirmation.
🔴 SELL / SHORT SETUP
Entry Zone: $63,300–$63,500 after a confirmed breakdown and failed retest.
Stop Loss: $64,500
Take Profit:
TP1: $61,900
TP2: $60,500
TP3: $58,500
Condition: Avoid entering before a confirmed breakdown. If BTC quickly reclaims $63,500, reconsider the setup.
🟢 BUY / LONG SETUP
Entry Zone: $66,400–$66,800 after a confirmed breakout and successful retest.
Stop Loss: $64,900
Take Profit:
TP1: $68,000
TP2: $70,000
TP3: $74,000
Condition: The long setup is countertrend until BTC establishes a stronger bullish daily structure.
Risk Management:
Risk only 0.5%–1% of trading capital per setup.
Avoid excessive leverage.
Wait for candle-close confirmation.
Do not chase large red or green candles.
If neither setup confirms, staying out of the market is also a valid decision.
8. Final Market Outlook
Bitcoin is currently in a critical technical zone.
The combination of a broken daily structure, extremely weak sentiment, ETF outflows, and oversold RSI creates a market where volatility could remain elevated.
My current preference is bearish continuation, but I would not ignore the possibility of a sharp relief rally.
The most important levels to watch today are:
$63,500 – Immediate support
$66,325 – Immediate resistance
$61,907 – Downside liquidity reference
$68,000 – First major recovery target
The next confirmed daily move around these levels could provide a clearer direction for Bitcoin.
Remember: The goal is not to predict every candle. The goal is to wait for confirmation, manage risk, and trade with a clear strategy.
What do you think? Will BTC break below $60K, or will buyers defend the current zone and push Bitcoin back toward $70K?
Share your BTC prediction in the comments! 👇
#BitcoinPriceUpdate #BTCUSDT.P #CryptoAnalysis📈📉🐋📅🚀 #BinanceSquareTalks #TradingSignals📞📞📞👇