$AXTI/$MVLL/$META 4-hour moving averages are bearish; short-term pressure 🔥
════════════════════
🟢 $AXTI 4-hour bearish signal
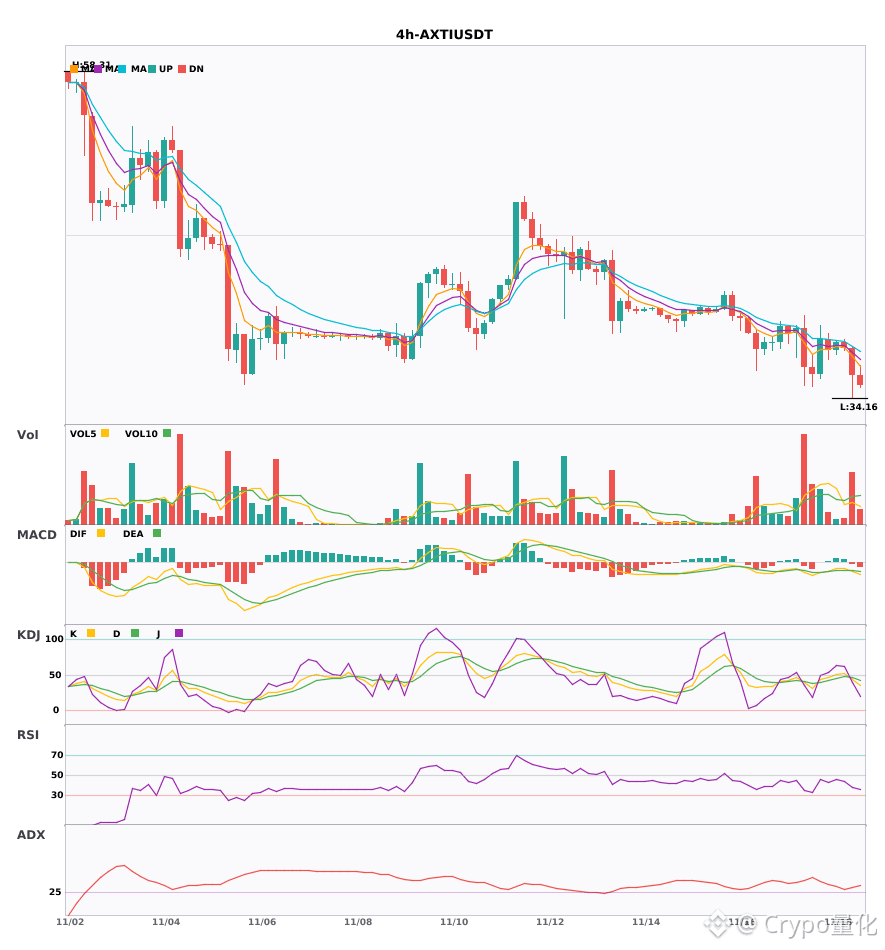
⚠️Technical analysis: ADX trend is forming, offering a potential entry. MACD bearish cross below zero indicates accelerating downside momentum. Moving averages have just formed a bearish alignment and are trending down. KDJ bearish cross; K has crossed below D but has not entered oversold territory. Volume is up 1.8x.
════════════════════
🟢 $MVLL 4-hour bearish signal
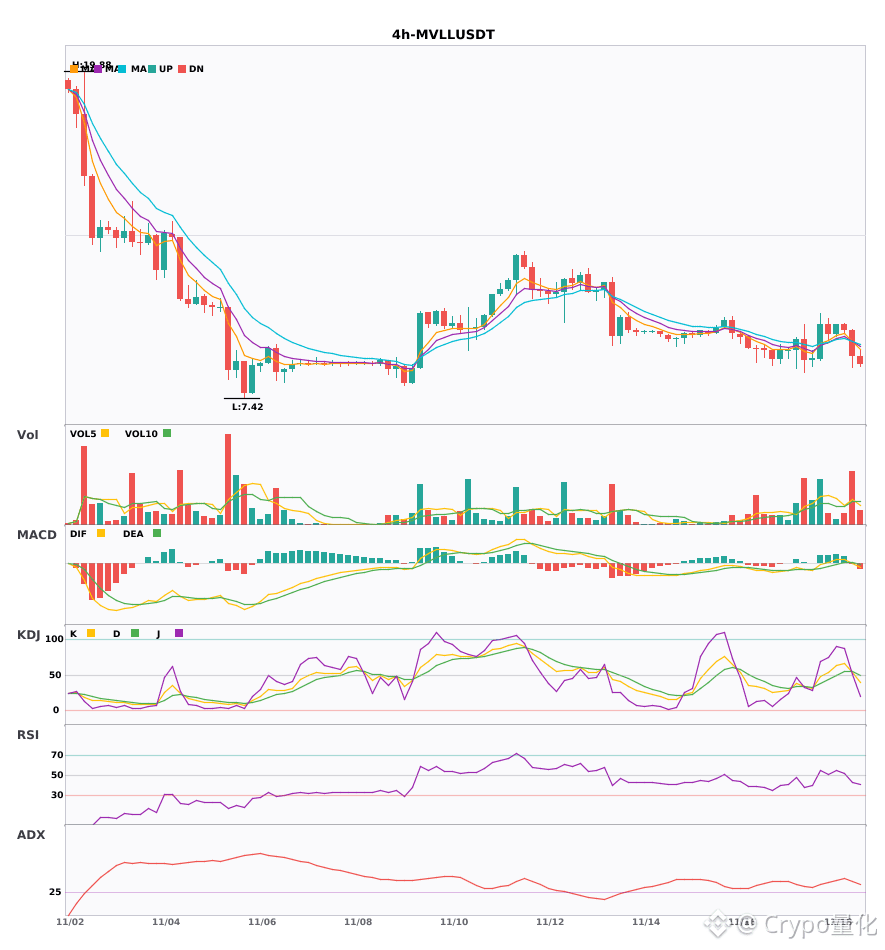
⚠️Technical analysis: ADX (41) indicates a fairly strong trend. MACD bearish cross below zero indicates accelerating downside momentum. EMA5 crossing below EMA8 signals a short-term bearish turn. KDJ bearish cross (K 53, D 54.5). Volume is up 2.3x.
════════════════════
🟢 $META 4-hour bearish signal
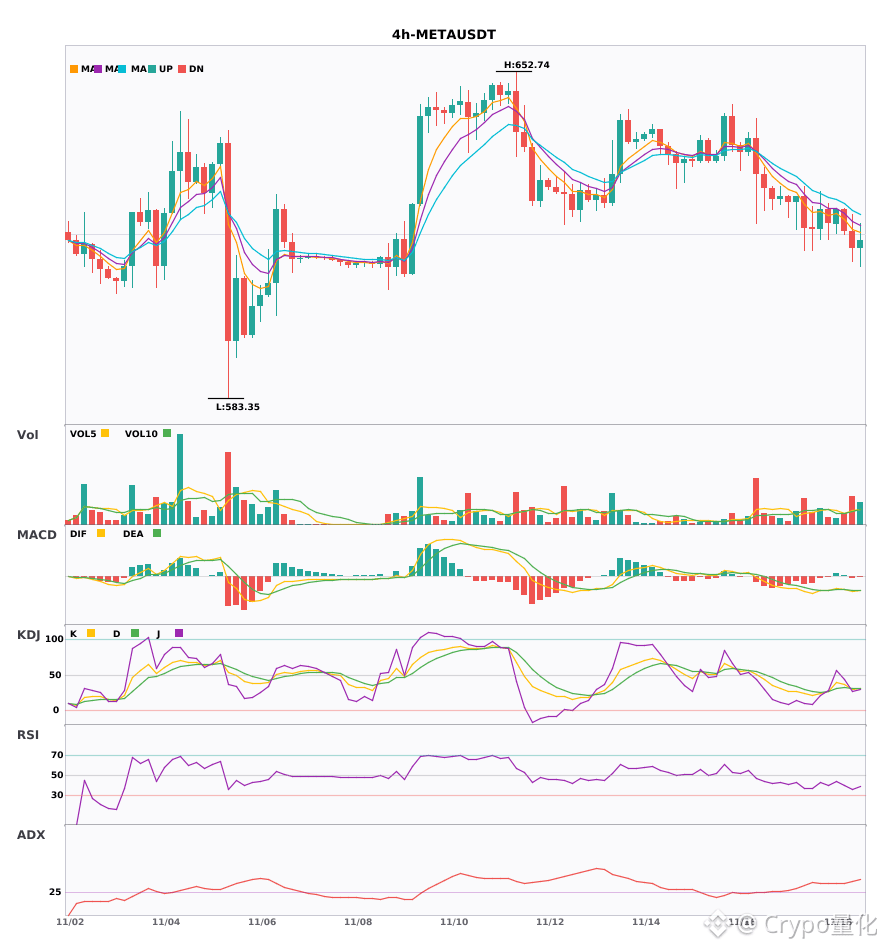
⚠️Technical analysis: ADX at 40 indicates a strong trend. MACD bearish cross below zero indicates accelerating downside momentum. Moving averages are bearishly aligned. KDJ bearish cross suggests a bearish outlook (K 30.1, D 31.8). Volume is up 2.1x.
════════════════════
🔔 Follow for real-time market alerts 🔔
#技术分析 #AXTI #MVLL #META
📌 When trading, pay attention to whether the candlestick patterns confirm the setup
════════════════════
🟢 $AXTI 4-hour bearish signal
⚠️Technical analysis: ADX trend is forming, offering a potential entry. MACD bearish cross below zero indicates accelerating downside momentum. Moving averages have just formed a bearish alignment and are trending down. KDJ bearish cross; K has crossed below D but has not entered oversold territory. Volume is up 1.8x.
════════════════════
🟢 $MVLL 4-hour bearish signal
⚠️Technical analysis: ADX (41) indicates a fairly strong trend. MACD bearish cross below zero indicates accelerating downside momentum. EMA5 crossing below EMA8 signals a short-term bearish turn. KDJ bearish cross (K 53, D 54.5). Volume is up 2.3x.
════════════════════
🟢 $META 4-hour bearish signal
⚠️Technical analysis: ADX at 40 indicates a strong trend. MACD bearish cross below zero indicates accelerating downside momentum. Moving averages are bearishly aligned. KDJ bearish cross suggests a bearish outlook (K 30.1, D 31.8). Volume is up 2.1x.
════════════════════
🔔 Follow for real-time market alerts 🔔
#技术分析 #AXTI #MVLL #META
📌 When trading, pay attention to whether the candlestick patterns confirm the setup