
$BTC
$BTC is testing a key level, and the daily close will tell us a lot. 📉
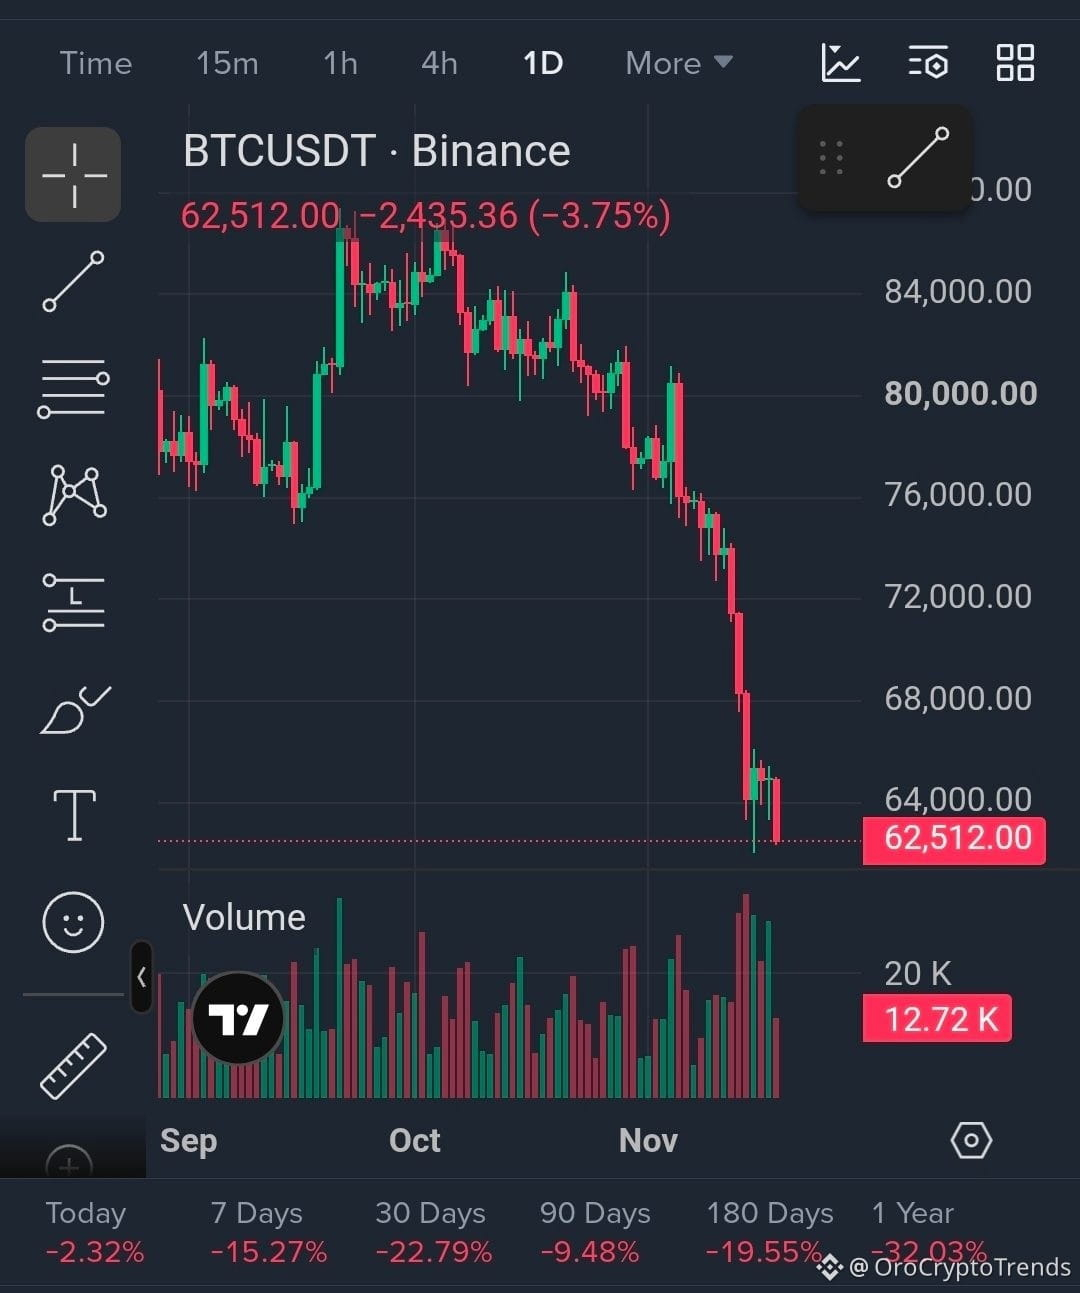
Bitcoin has dropped sharply over the past two weeks, and price is now sitting on its recent wick low. According to Binance’s BTC/USDT daily chart, BTC trades near $62,512, down about 15% over 7 days and 23% over 30 days.
What the chart shows:
🔻 Trend: The daily structure is bearish, with lower highs since the October peak and lower lows in November.
🔻 Broken support: The $74K-$76K zone held in September but failed in November. It is now resistance.
🔻 Momentum: The drop from about $76K to $64K came as a run of large red candles with very little pullback. That is momentum selling.
🔻 Failed bounce: A high-volume green candle appeared near $62K-$64K with a long lower wick, which suggests dip buying. But there was no follow-through, and price rolled over into a new red candle.
Key levels to watch:
🟥 Resistance: $64K-$65K, $68K, $74K-$76K
🟩 Support: $62K, then $60K
Two scenarios:
Bearish: A daily close below $62K would confirm continuation, with $60K as the next target.
Bullish: If $62K holds and price reclaims $64K-$65K on a daily close with rising volume, a relief bounce toward $68K becomes possible. Even then, the trend only changes if price gets back above $76K.
What I’m watching: the daily close relative to $62K (not intraday wicks) and whether any bounce comes on rising or fading volume.
No hype and no prediction, just levels and conditions. Let the chart confirm the move.
⚠️ This is a chart read, not financial advice. Always manage your risk and do your own research.
What’s your read: does $62K hold or break? 👇
#BTC #Bitcoin
$BTC is testing a key level, and the daily close will tell us a lot. 📉
Bitcoin has dropped sharply over the past two weeks, and price is now sitting on its recent wick low. According to Binance’s BTC/USDT daily chart, BTC trades near $62,512, down about 15% over 7 days and 23% over 30 days.
What the chart shows:
🔻 Trend: The daily structure is bearish, with lower highs since the October peak and lower lows in November.
🔻 Broken support: The $74K-$76K zone held in September but failed in November. It is now resistance.
🔻 Momentum: The drop from about $76K to $64K came as a run of large red candles with very little pullback. That is momentum selling.
🔻 Failed bounce: A high-volume green candle appeared near $62K-$64K with a long lower wick, which suggests dip buying. But there was no follow-through, and price rolled over into a new red candle.
Key levels to watch:
🟥 Resistance: $64K-$65K, $68K, $74K-$76K
🟩 Support: $62K, then $60K
Two scenarios:
Bearish: A daily close below $62K would confirm continuation, with $60K as the next target.
Bullish: If $62K holds and price reclaims $64K-$65K on a daily close with rising volume, a relief bounce toward $68K becomes possible. Even then, the trend only changes if price gets back above $76K.
What I’m watching: the daily close relative to $62K (not intraday wicks) and whether any bounce comes on rising or fading volume.
No hype and no prediction, just levels and conditions. Let the chart confirm the move.
⚠️ This is a chart read, not financial advice. Always manage your risk and do your own research.
What’s your read: does $62K hold or break? 👇
#BTC #Bitcoin