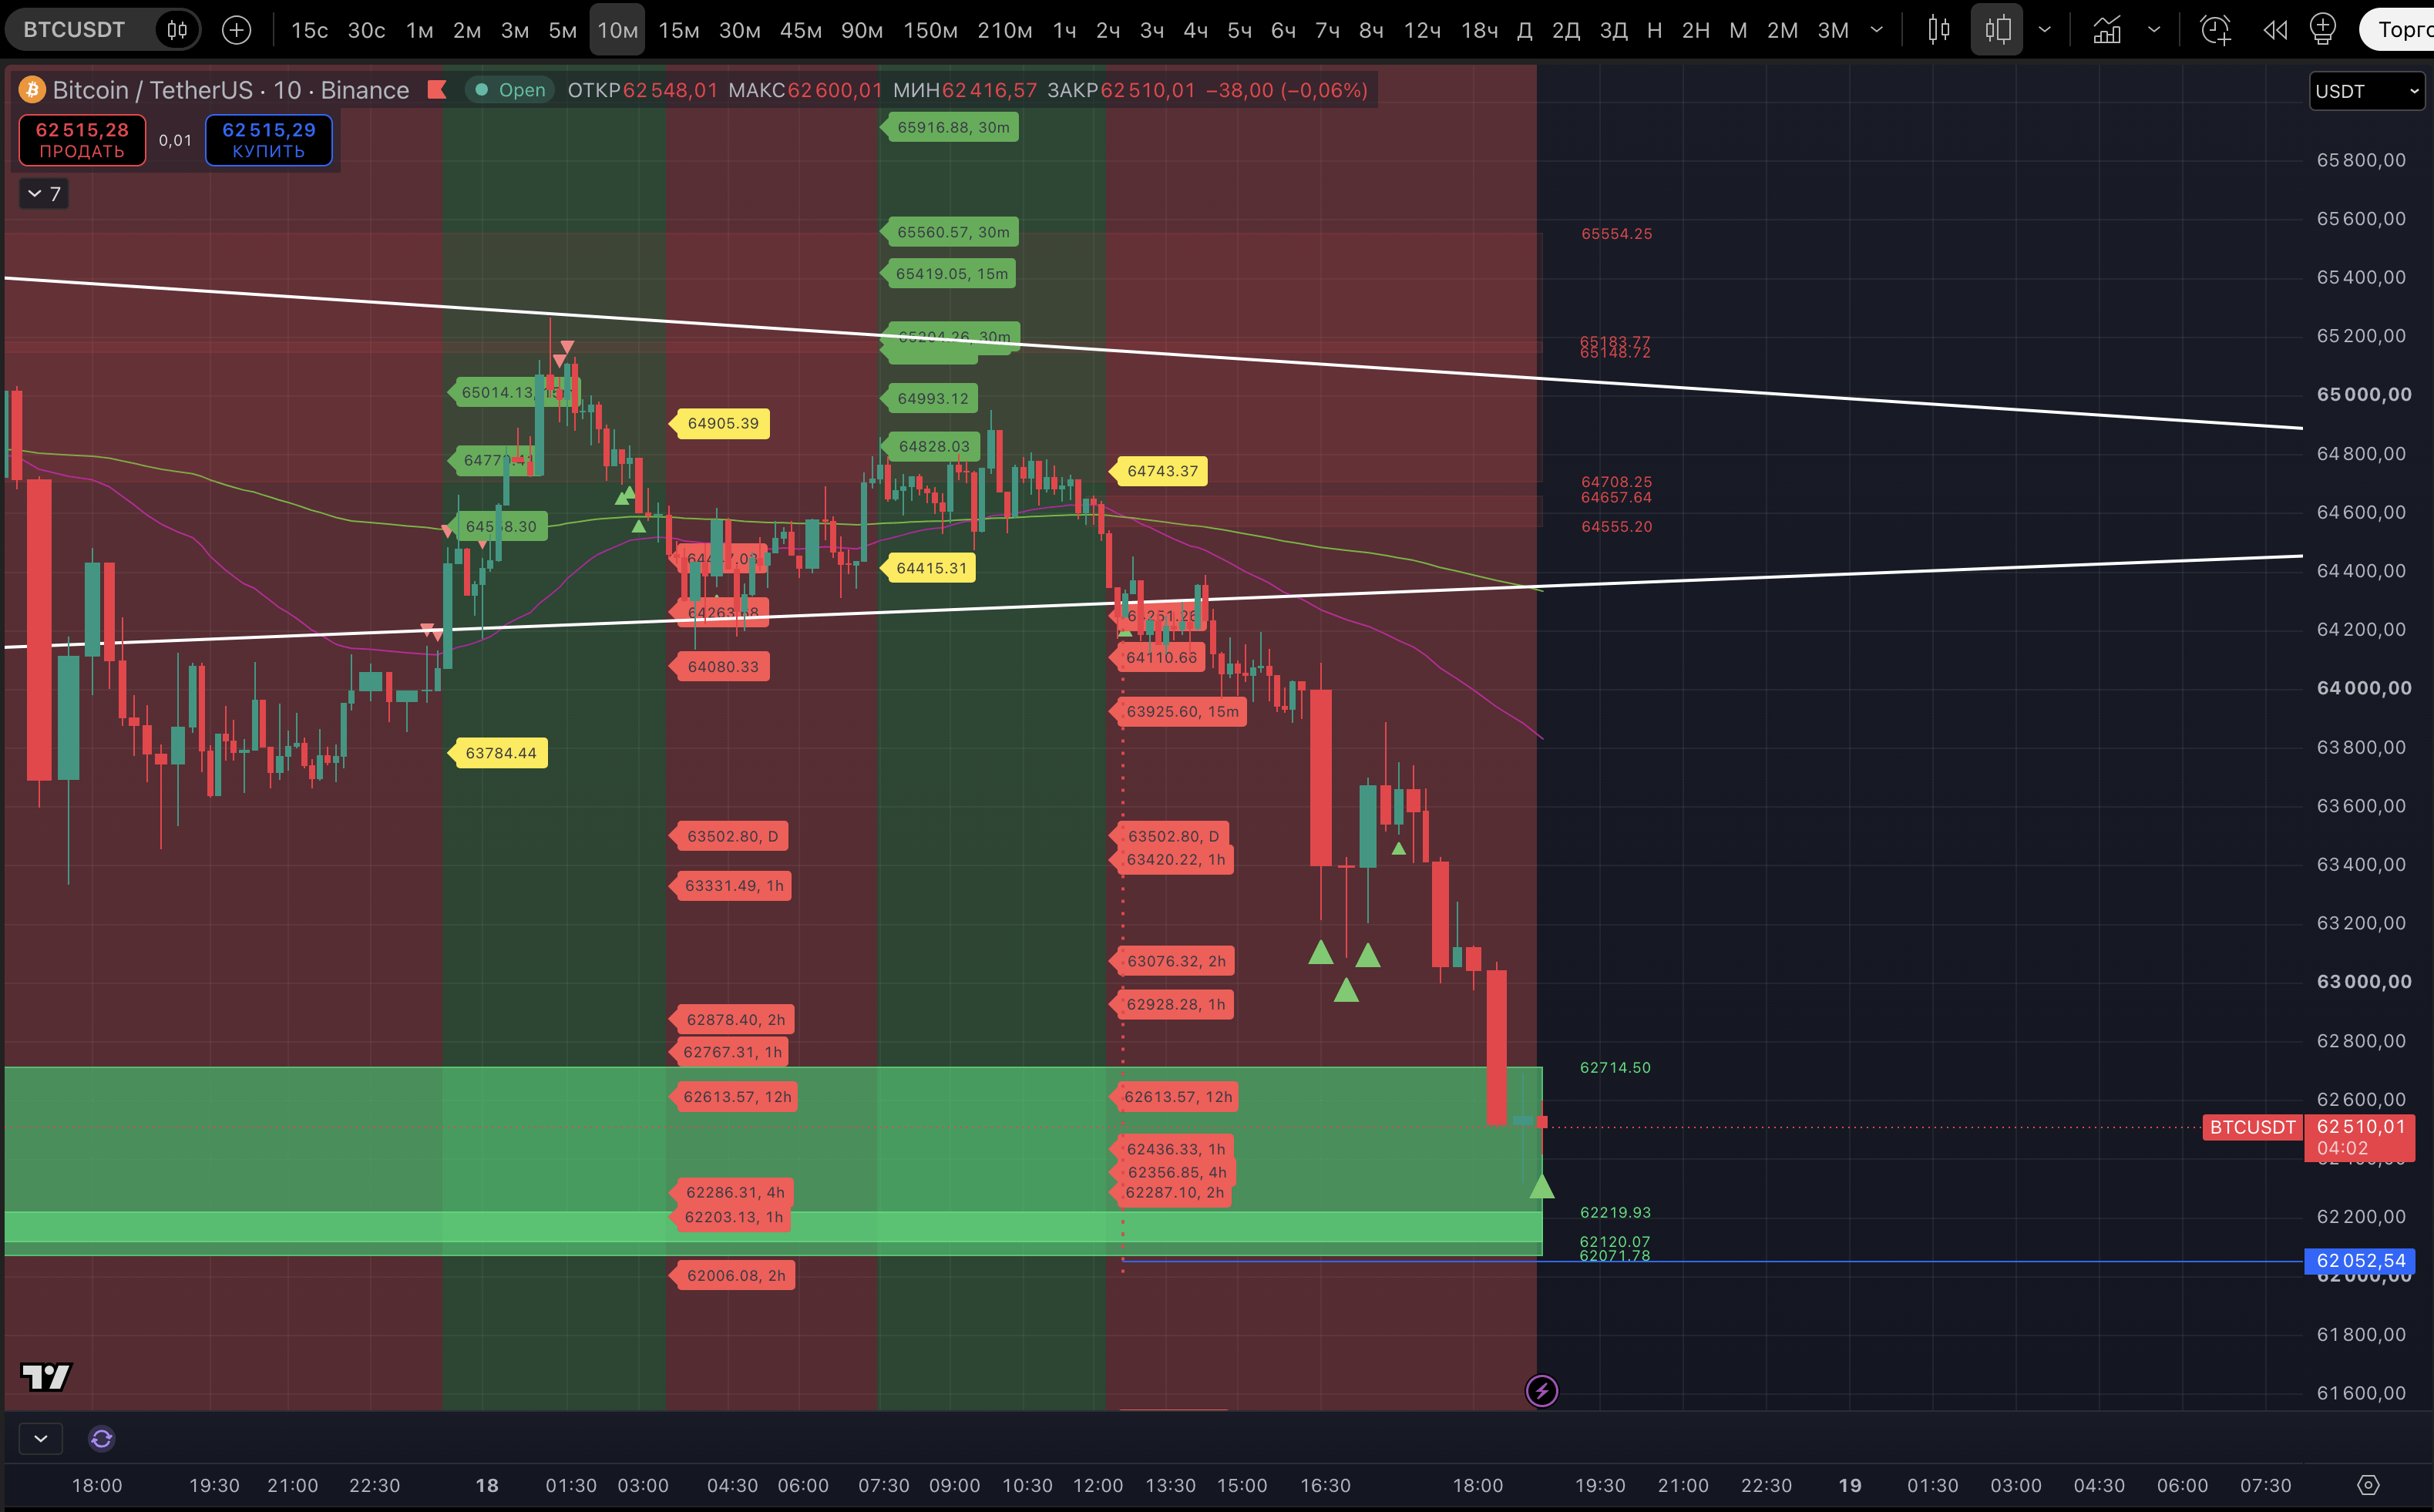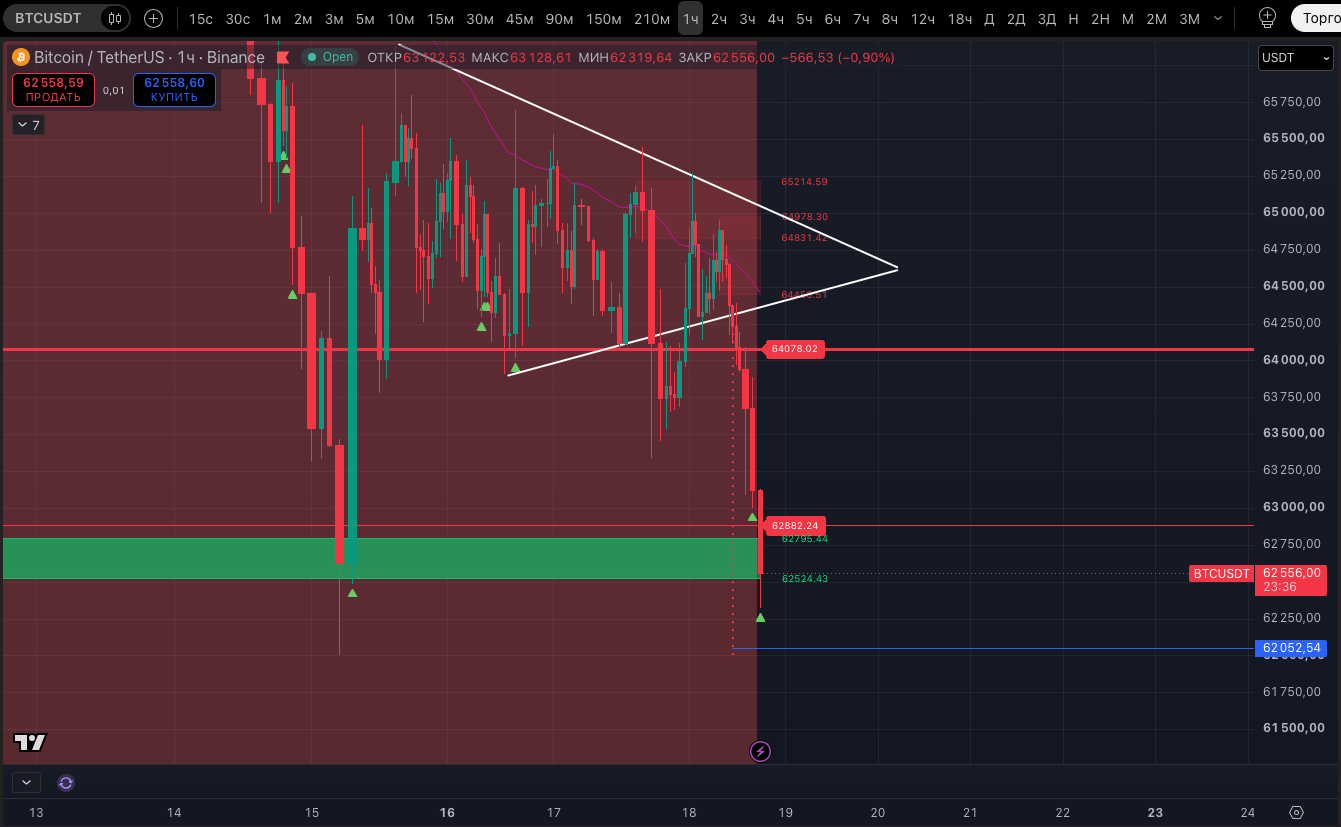


BTC has almost reached the full target of the "Triangle"; the move was quick.
The current low is $62,319, while the pattern’s full target, as a reminder, is around $62,052.
Things are at least heading toward a "Double Bottom," and, as expected, there is a chance of the November 15 low being revised; it’s already very close at $62,006.
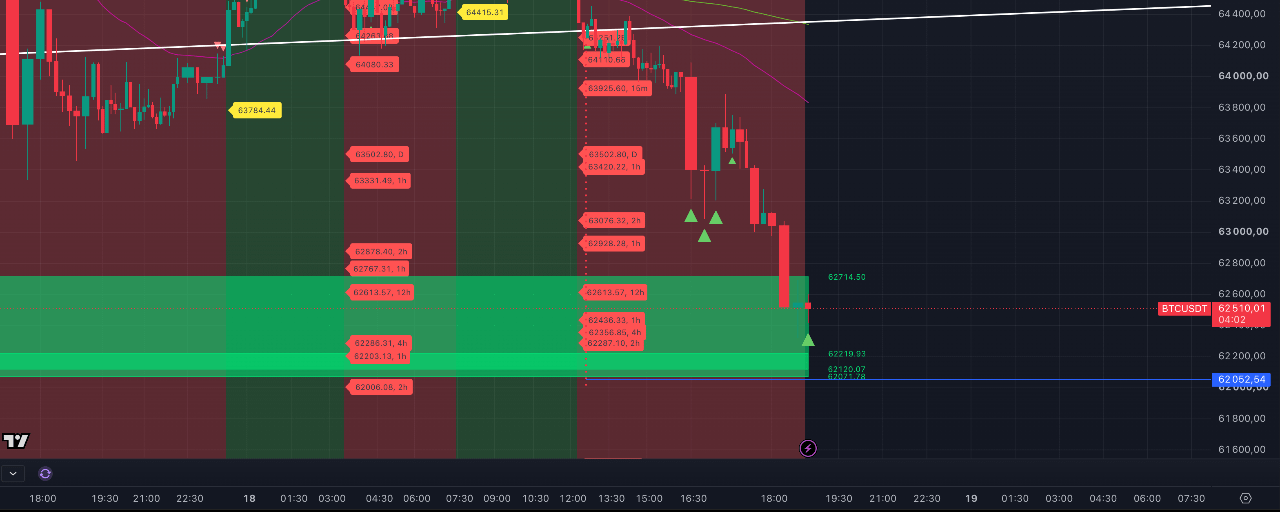
Local Strong Signal indicators for a potential low on the 10-minute timeframe played out as an equally local rebound, and the price is now showing repeated strong signals on this timeframe. At the same time, the price entered the $62,071–$62,714 liquidity zone as support.
There is also a liquidity zone acting as support on the 1-hour timeframe, at $62,524–$62,795. But right now, it is at high risk of being absorbed. Absorption will occur if the hourly candle closes below $62,524. We’ll check back in 20 minutes.
For now, it’s hard to believe that since the price has come so close to the November 15 low, the liquidity below won’t be taken. We wrote in the overview:
"... The next support on the 1-hour chart according to the indicator is at just $62,882, with the $62,524–$62,795 liquidity zone nearby. This combination of support levels will be an important test for buyers if the price falls. A break below them would open the way to the $59,892 level and the $60,079–$60,340 liquidity zone..."