$DASH : The Loud Auction Room: Why the Fastest Bidder Usually Overpays
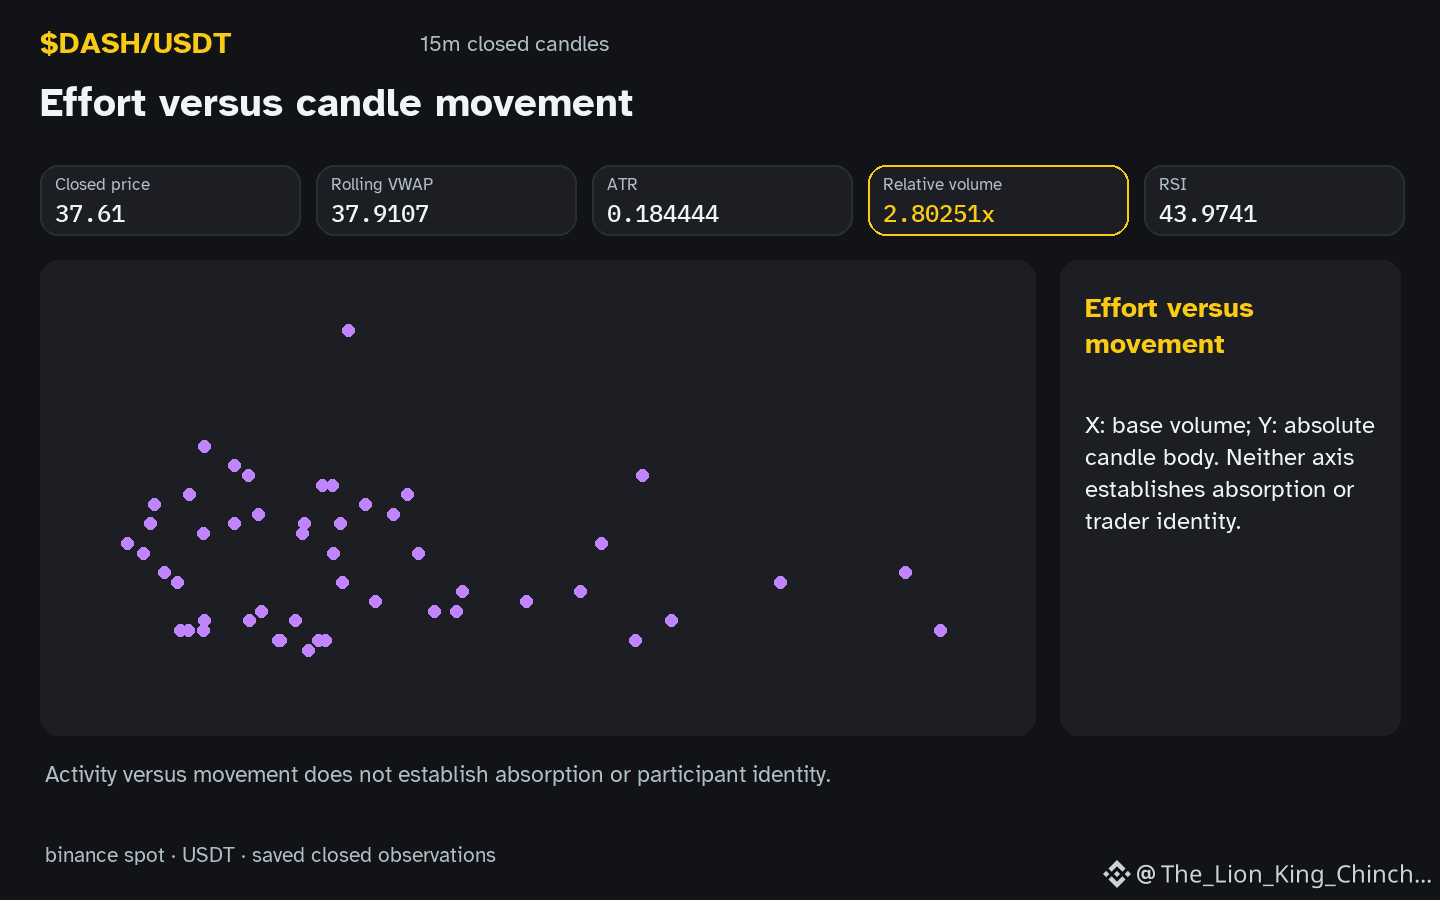
The hourly candle for $DASH is down with relative volume 2.80x baseline. Imagine a live auction where the fastest bidder shouts a price before others can react. That speed often leads to overpaying because the bidder cannot see the full order book. A breakout candle works similarly: a rapid price move on high volume may reflect a few aggressive market orders hitting thin limit layers, not broad conviction. The observation shows price inside the recorded range, hourly direction down, and volume above baseline. RSI reads 44.0. These facts describe only the saved snapshot, not a forecast. If the next closed candle reverts toward the range midpoint on lower relative volume, the auction analogy weakens. Conversely, a follow-through candle with sustained volume might support the idea of continued urgency. The mechanism is hypothetical; candles and volume alone cannot confirm motive, absorption, or causation. A useful reassessment is to watch whether subsequent candles maintain the same volume intensity or decay quickly.
Probabilistic market research, not a recommendation or guaranteed return.
Watchlist contrast: $ETH has hourly direction down and volume above its baseline; $MMT has hourly direction down and volume not above its baseline. This alone does not establish correlation.
The label or the mechanism behind it?
#DASH #ETH #MMT #CryptoEducation #CryptoLearning
The hourly candle for $DASH is down with relative volume 2.80x baseline. Imagine a live auction where the fastest bidder shouts a price before others can react. That speed often leads to overpaying because the bidder cannot see the full order book. A breakout candle works similarly: a rapid price move on high volume may reflect a few aggressive market orders hitting thin limit layers, not broad conviction. The observation shows price inside the recorded range, hourly direction down, and volume above baseline. RSI reads 44.0. These facts describe only the saved snapshot, not a forecast. If the next closed candle reverts toward the range midpoint on lower relative volume, the auction analogy weakens. Conversely, a follow-through candle with sustained volume might support the idea of continued urgency. The mechanism is hypothetical; candles and volume alone cannot confirm motive, absorption, or causation. A useful reassessment is to watch whether subsequent candles maintain the same volume intensity or decay quickly.
Probabilistic market research, not a recommendation or guaranteed return.
Watchlist contrast: $ETH has hourly direction down and volume above its baseline; $MMT has hourly direction down and volume not above its baseline. This alone does not establish correlation.
The label or the mechanism behind it?
#DASH #ETH #MMT #CryptoEducation #CryptoLearning