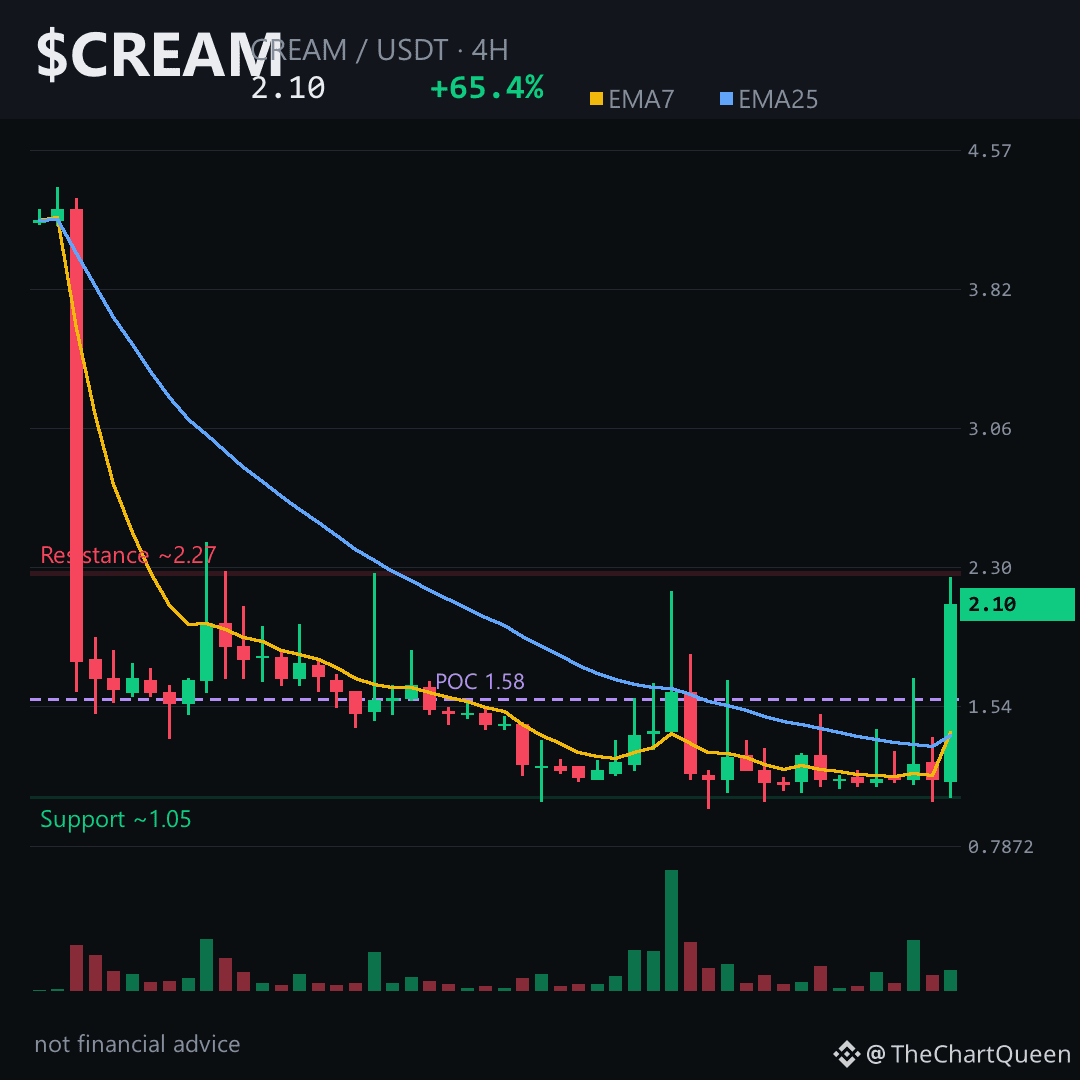
Why did $CREAM just print an 84% candle while the bigger picture still looks broken?
That’s the quiet question under every “Top Gainer” tag — and the answer sits in the 4-hour chart, not the headlines.
Price ripped from 1.05 to 2.25 in a single 4H candle. That’s a volatility spike — the kind that stretches any short-term trend thin. 4H EMAs finally turned upward, RSI is warm but not overheated. Still, the daily EMA7 is buried far below the EMA25. Short-term engine revving, longer trend still pointing downhill. One of them eventually wins.
The level I’m watching on $CREAM is the 1.98 zone. That’s the short-term floor — where this impulse proves it has real demand, or quietly rolls over. Hold it on a 4H close, and the path tilts toward 2.28. Lose it, and the bounce starts looking like a one-candle wonder. Tap $CREAM to pull the chart up and check that zone yourself.
My read: violent counter-trend bounce inside a still-bearish structure. The real risk isn’t missing the move — it’s trusting it before the 1.98 floor confirms.
I’ll keep the 4H structure updated as this resolves — follow so the next read lands in your feed. Which zone are you trusting more on CREAM right now — 1.98 or 2.28? 👇
⚠️ Not financial advice. DYOR.
#CREAM #DeFi #Crypto #BinanceSquare
That’s the quiet question under every “Top Gainer” tag — and the answer sits in the 4-hour chart, not the headlines.
Price ripped from 1.05 to 2.25 in a single 4H candle. That’s a volatility spike — the kind that stretches any short-term trend thin. 4H EMAs finally turned upward, RSI is warm but not overheated. Still, the daily EMA7 is buried far below the EMA25. Short-term engine revving, longer trend still pointing downhill. One of them eventually wins.
The level I’m watching on $CREAM is the 1.98 zone. That’s the short-term floor — where this impulse proves it has real demand, or quietly rolls over. Hold it on a 4H close, and the path tilts toward 2.28. Lose it, and the bounce starts looking like a one-candle wonder. Tap $CREAM to pull the chart up and check that zone yourself.
My read: violent counter-trend bounce inside a still-bearish structure. The real risk isn’t missing the move — it’s trusting it before the 1.98 floor confirms.
I’ll keep the 4H structure updated as this resolves — follow so the next read lands in your feed. Which zone are you trusting more on CREAM right now — 1.98 or 2.28? 👇
⚠️ Not financial advice. DYOR.
#CREAM #DeFi #Crypto #BinanceSquare