


Bitcoin has pulled back sharply from its highs, and at a time like this, one question naturally comes to mind: Is a rebound just around the corner? Today, I’ll use the 1-2-3 rule from Dow Theory to break this down. You only need to watch three things: the trendline, the most recent swing highs and lows, and whether the price can break through the key level.
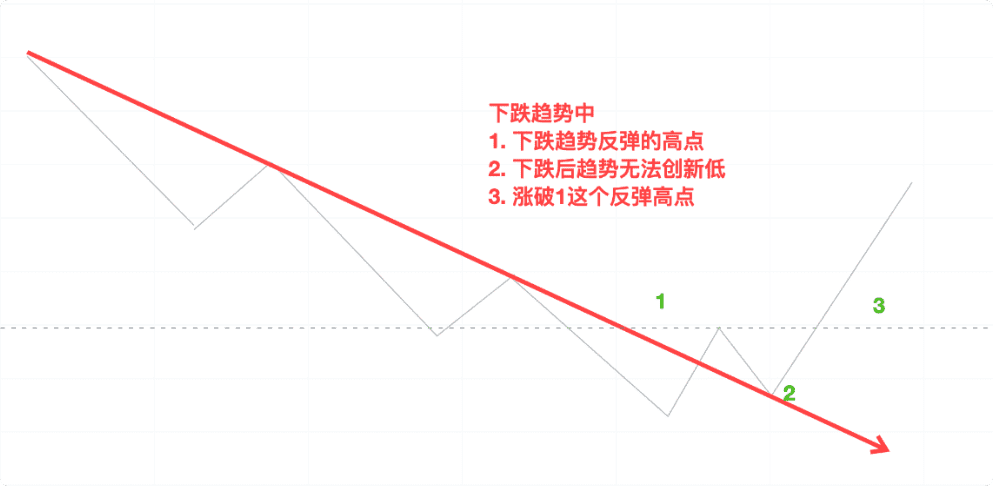
In a downtrend, I start by drawing a descending trendline. After the price has fallen for a while, it rebounds; I mark the rebound high as 1. Then the price pulls back. As long as it doesn’t make a new low, I mark the pullback low as 2. Once the price breaks above the trendline and moves past the high at 1, point 3 is confirmed. If the price breaks below 2 before confirmation, the basis for this rebound no longer holds.
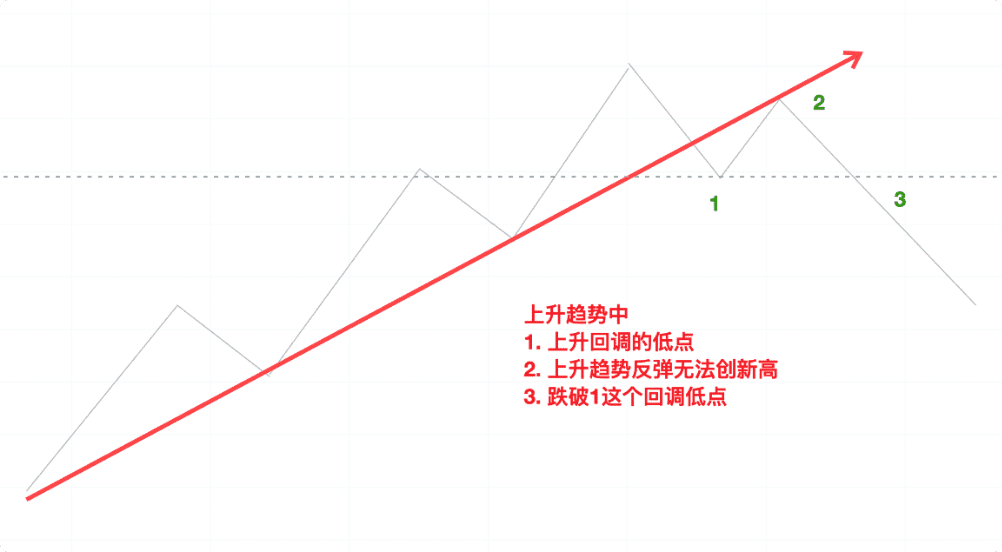
When an uptrend is nearing its end, look at it the other way around. The low of the first pullback is point 1. The subsequent rebound fails to make a new high, and that high becomes point 2. After the uptrend line is broken, point 3 only forms if the price also falls below the low at point 1. A break of the trendline alone is just a warning that the previous upward momentum may have shifted; next, we still need to see whether the key low holds.
By the time points 2 and 3 have both formed, you often have to give up the earliest part of the move. That time lag is the cost of waiting for confirmation. In real trading, highs and lows rarely line up as neatly as they do in a diagram. If you start counting points as soon as you see a bullish candlestick, it’s easy to force the pattern you want to see onto the chart.
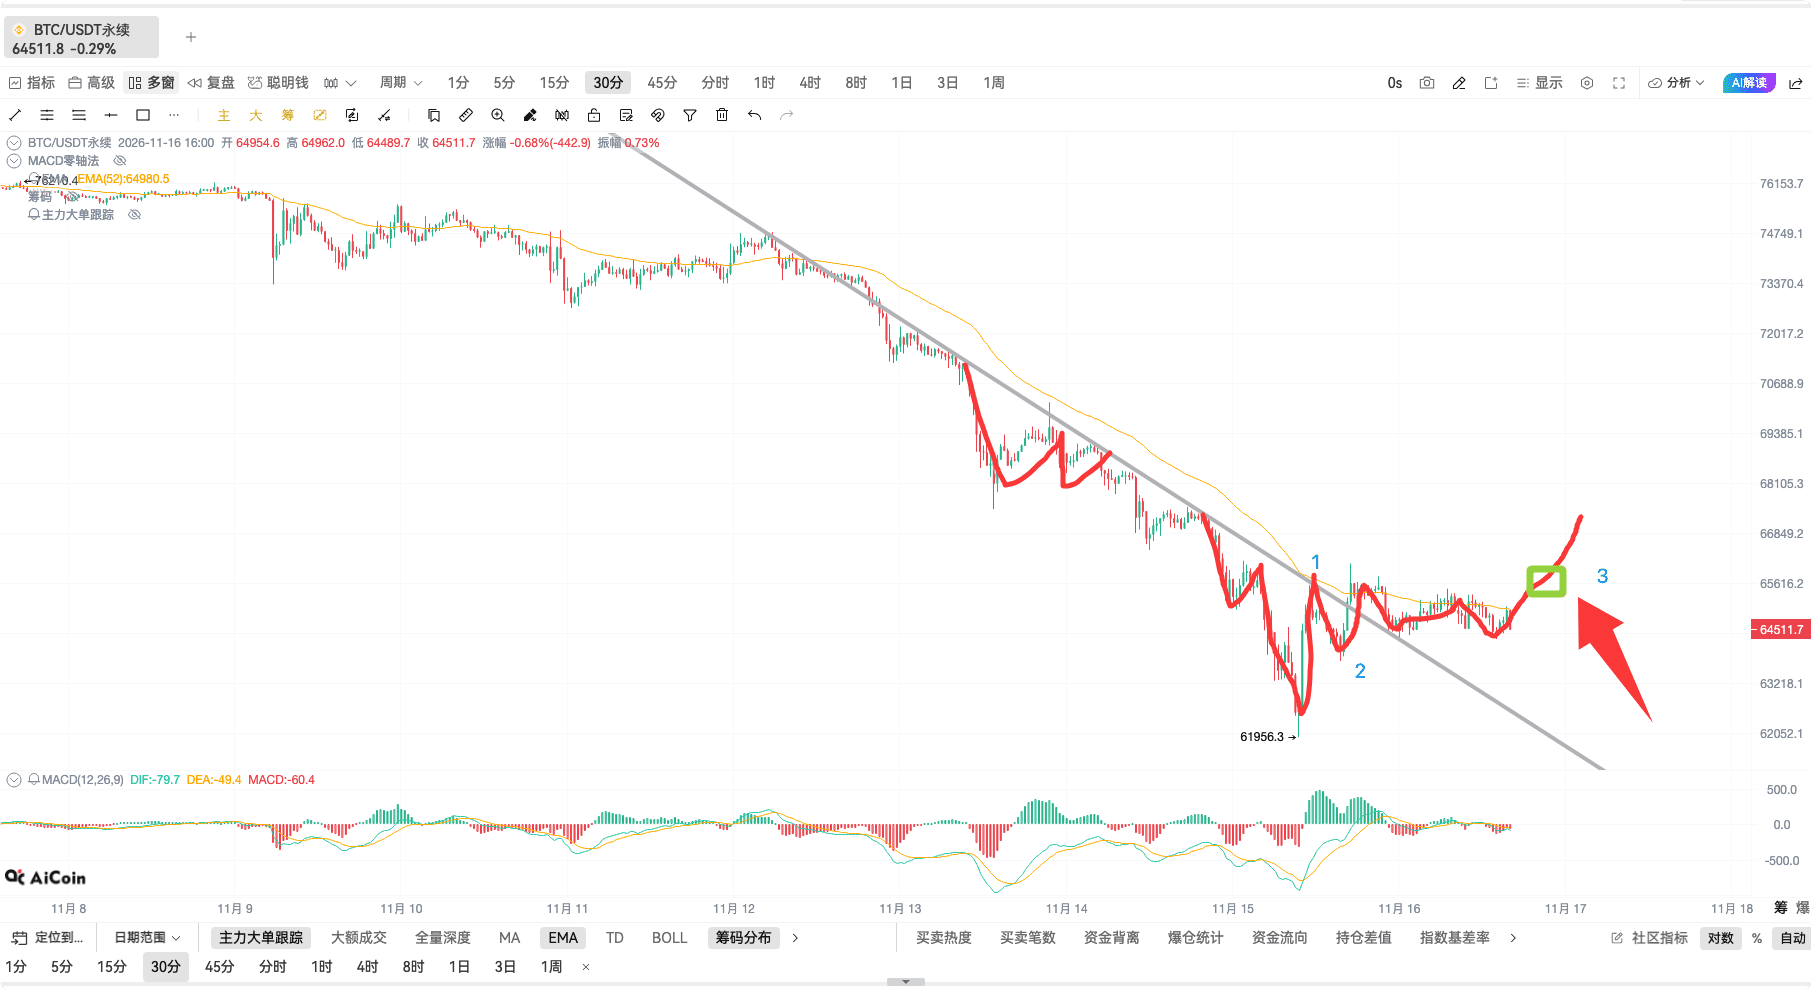
Let’s look at the BTC 30-minute chart from the livestream. The chart already has rebound high 1 and a pullback point 2 that did not make a new low. Point 3 had not appeared yet, so the subsequent price action shown on the chart was only a projection. We can confirm this step only once the price actually moves above the high at point 1.
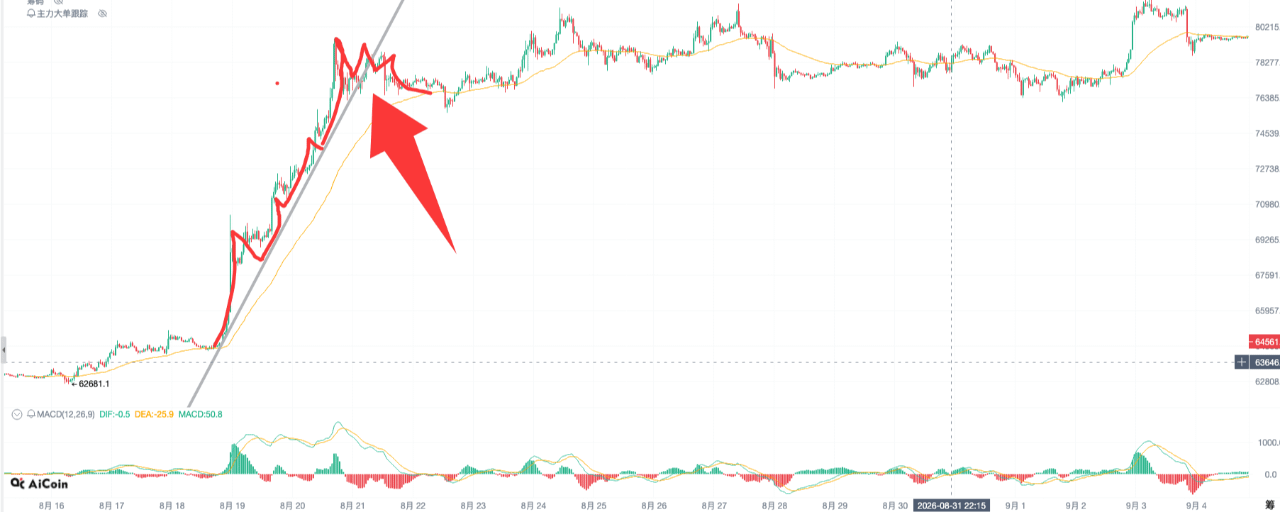
Let’s look at another stretch of BTC’s historical price action. After the previous uptrend ended, the market weakened, but it did not form a textbook 1-2-3 pattern. It’s worth keeping charts like this too; next time we discuss the 2B rule, we can compare them side by side.
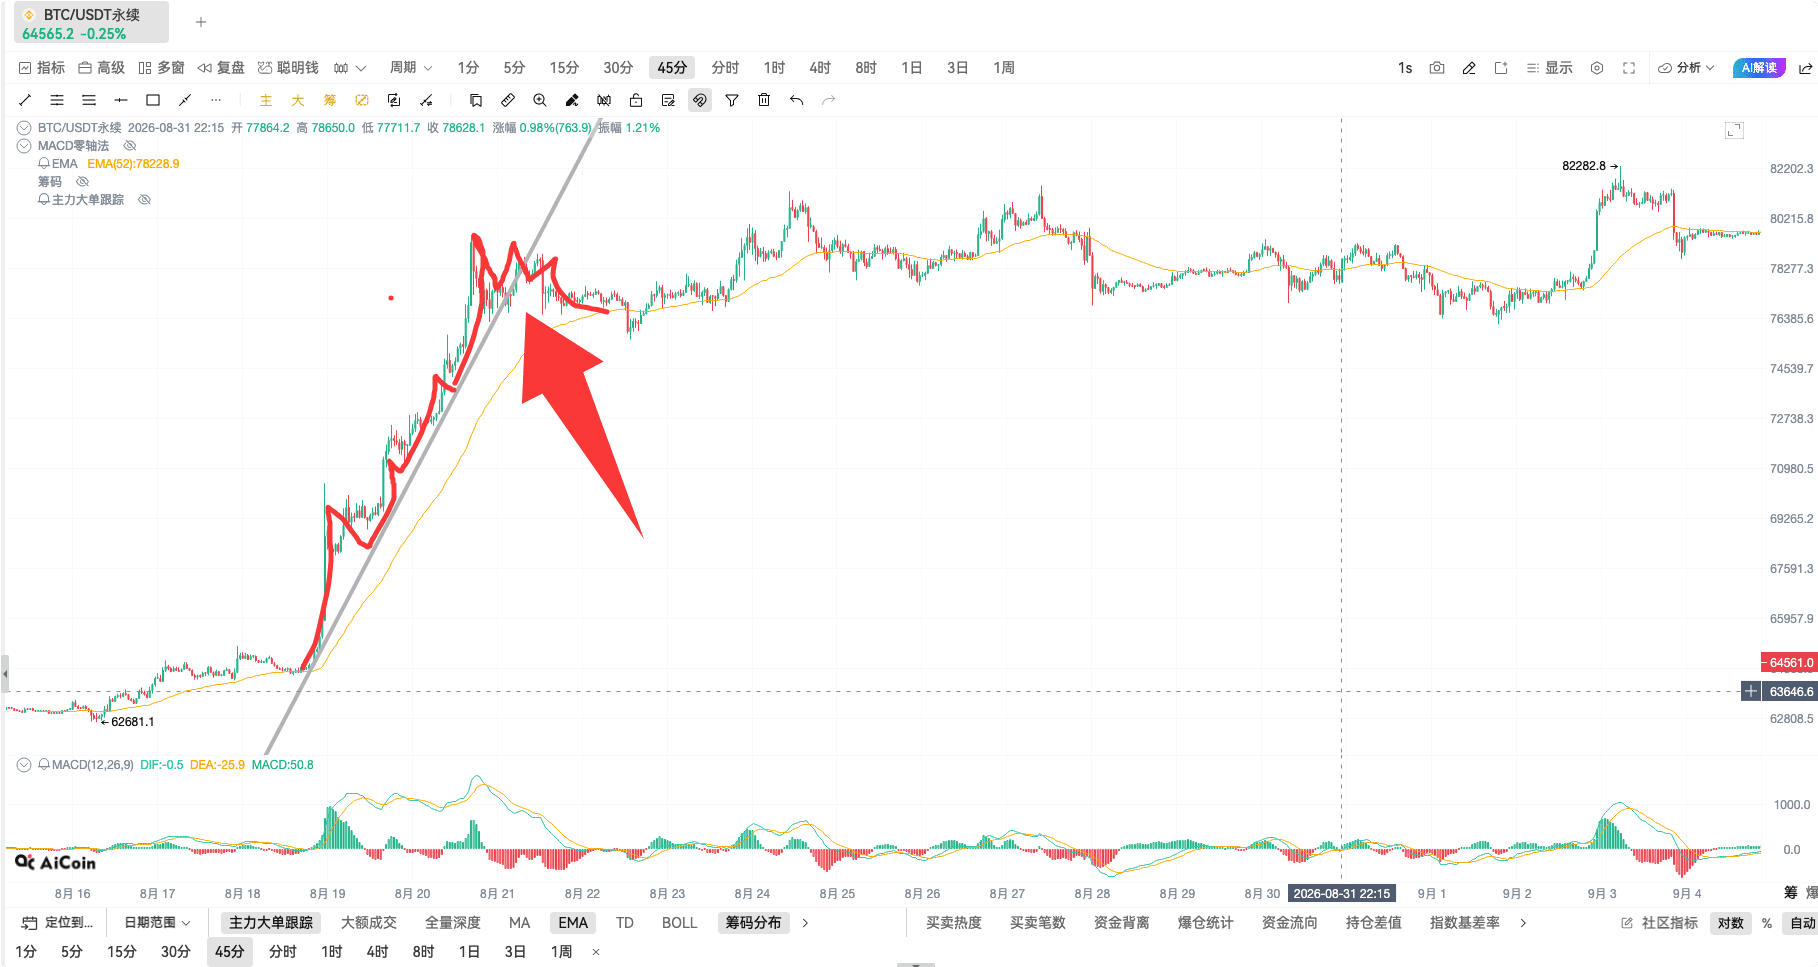
During the same livestream, ETH had not even broken above its downtrend line. If BTC forms a structure first, it can serve as a reference. For ETH, though, we still need to look at its own chart and see whether the trendline has been broken and whether the key high has been taken out.
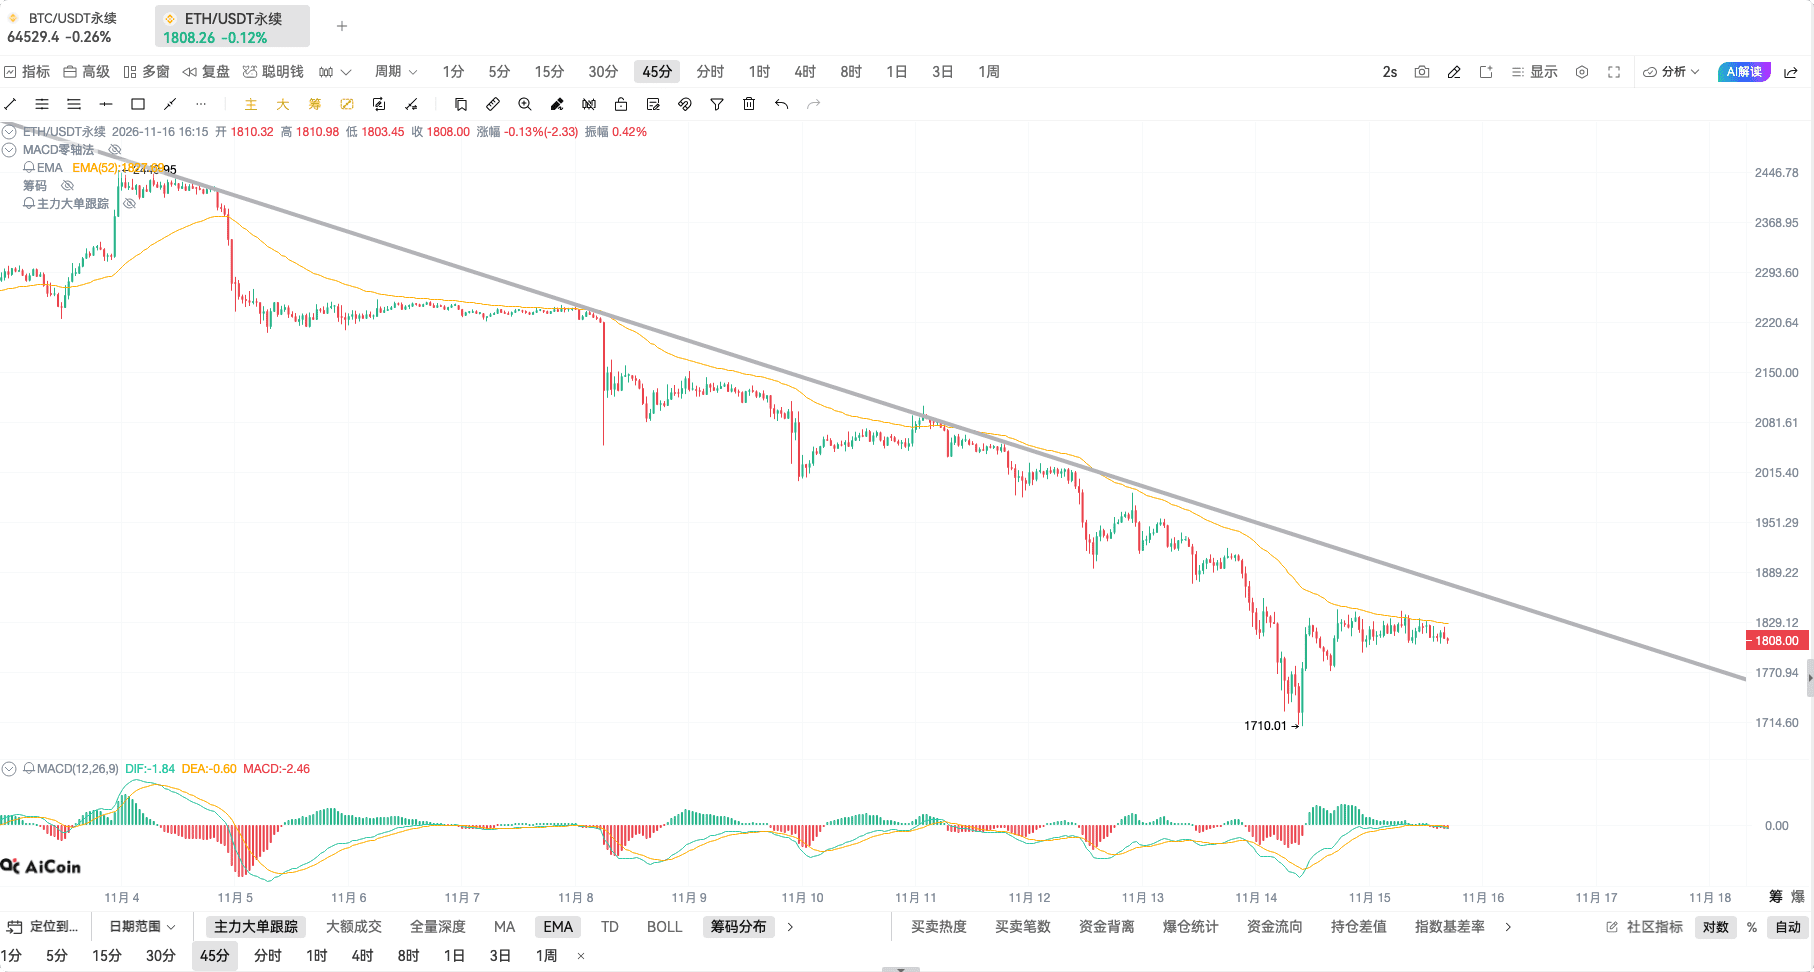
When practicing with historical candlestick charts, you can start by drawing a trendline and marking points 1 and 2. Then draw a line on the chart and see how far the price needs to move for point 3 to form. If the market hasn’t reached that step, just leave it blank for now.
We livestream every day. Follow along and join the AiCoin community to watch.