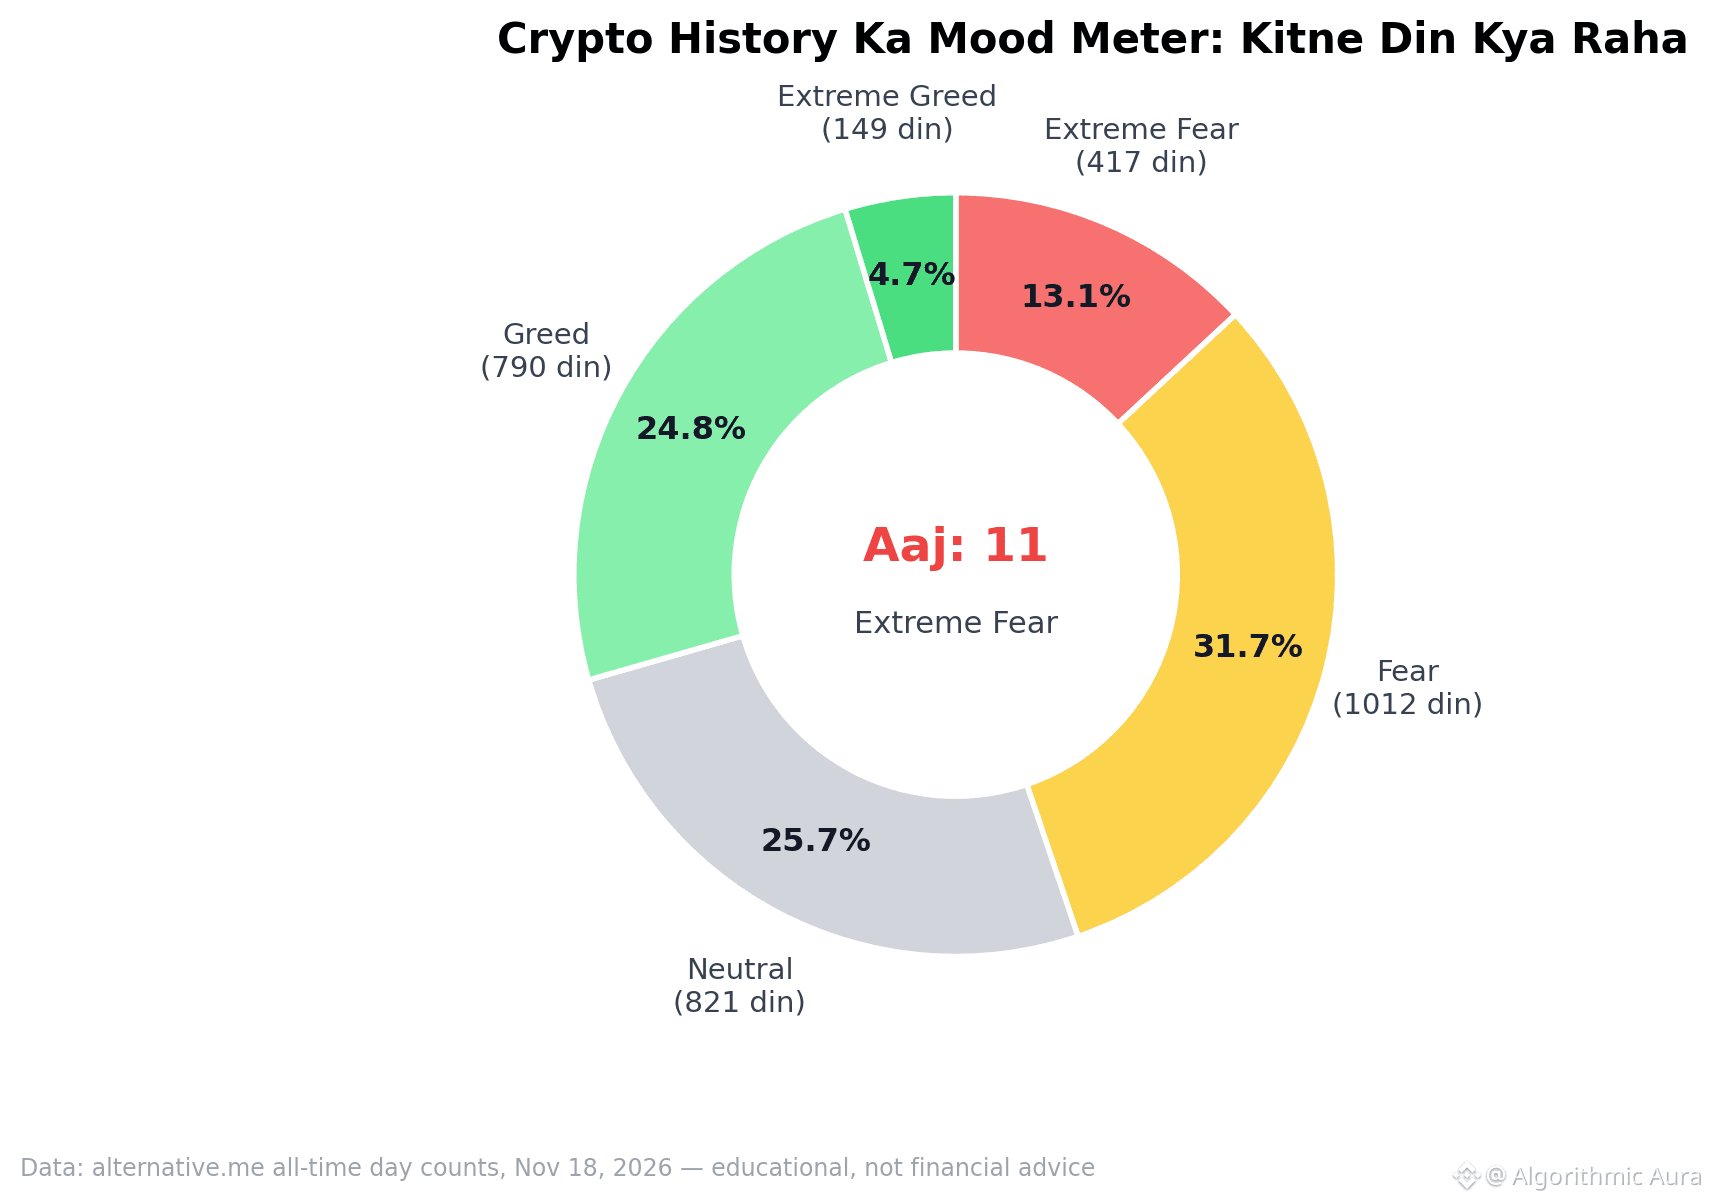
🍩 One chart: the mood distribution throughout crypto history — where are we today?
1️⃣ Extreme Fear: just 13.1% of days (417 days)
2️⃣ Fear: 31.7% (1,012) — the most common
3️⃣ Neutral: 25.7%, Greed: 24.8%
4️⃣ Extreme Greed: 4.7% (149) — the rarest
5️⃣ Today: 11 — in the Extreme Fear club, among the most painful 13% of historical windows
The distribution provides context: extreme readings on both ends are rare. Rarity doesn’t mean a reversal — only that these conditions are uncommon.
Illustrative chart — Alternative.me all-time data.
$BTC #FearAndGreed #CryptoMarket #MarketUpdate
1️⃣ Extreme Fear: just 13.1% of days (417 days)
2️⃣ Fear: 31.7% (1,012) — the most common
3️⃣ Neutral: 25.7%, Greed: 24.8%
4️⃣ Extreme Greed: 4.7% (149) — the rarest
5️⃣ Today: 11 — in the Extreme Fear club, among the most painful 13% of historical windows
The distribution provides context: extreme readings on both ends are rare. Rarity doesn’t mean a reversal — only that these conditions are uncommon.
Illustrative chart — Alternative.me all-time data.
$BTC #FearAndGreed #CryptoMarket #MarketUpdate