Market Overview & Price Action
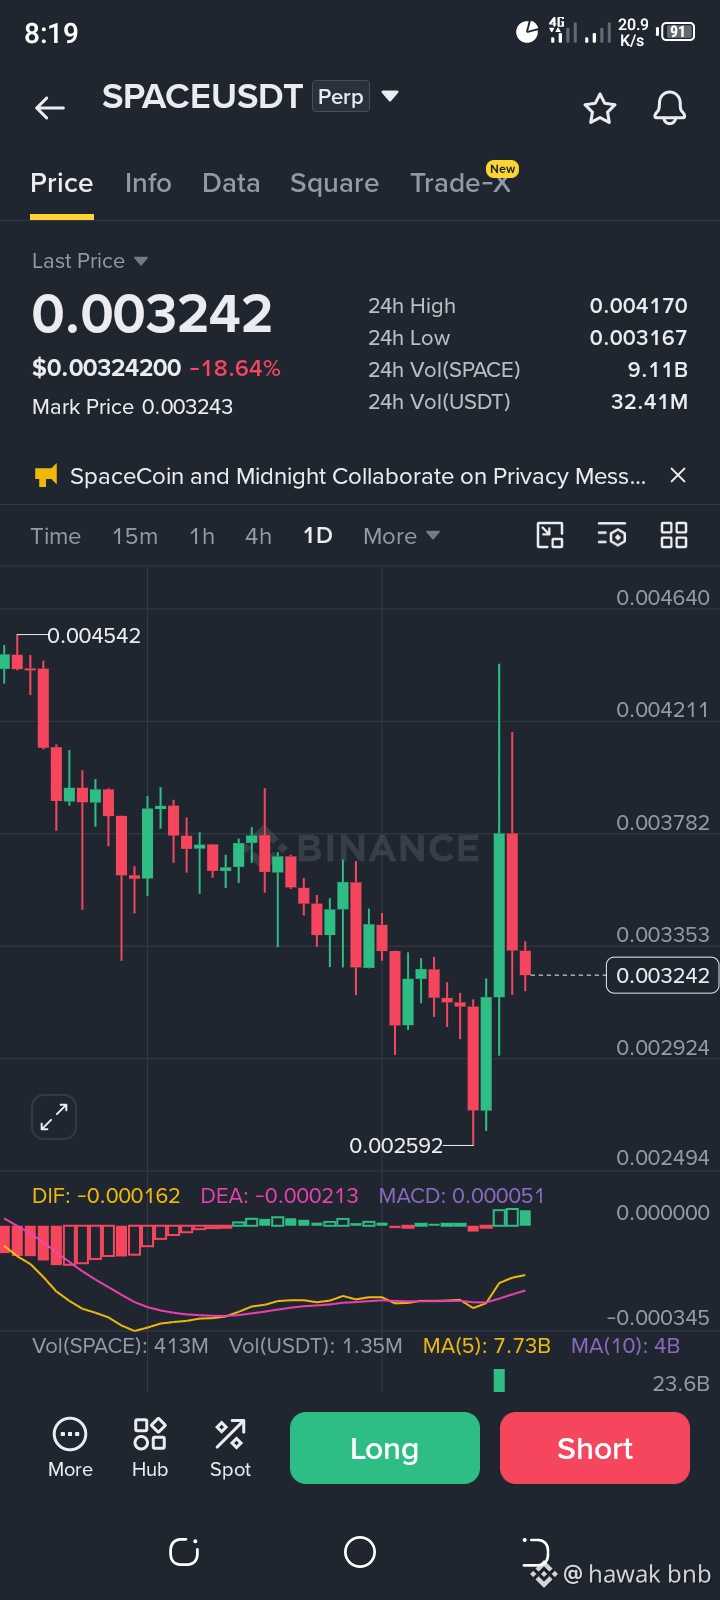
The screenshot displays a 1-day (1D) technical candlestick chart for SPACE/USDT on Binance. The current last traded price stands at $0.003242, reflecting an intraday decline of -18.64%. Following a sharp corrective downtrend from a previous peak near $0.004542, the asset recently rebounded from a low of $0.002592 via an aggressive green impulse candle before retracing to its current mid-range level.
24-Hour Range & Trading Volume
Over the past 24 hours, SPACE recorded a high of $0.004170 and a low of $0.003167. Market participation and liquidity remain robust, supported by a 24-hour trading volume of 9.11B SPACE and 32.41M USDT. An announcement ticker at the top also notes ongoing project updates, indicating that SpaceCoin and Midnight are collaborating on privacy messaging.
Technical Indicators (MACD & Moving Averages)
MACD: In the lower indicator panel, the MACD metrics show DIF: -0.000162, DEA: -0.000213, and MACD: 0.00051. The MACD histogram has transitioned into positive territory with green bars forming, and the DIF line has crossed above the DEA line, signaling a potential shift toward short-term bullish momentum. @Space #spaceusdt $SPACE
#CanNvidia’sDataCenterGrowthContinue? #NvidiaBoardNotConsideringHuang’sReturnasCEO #KOSPIFalls2.59%ToLowestCloseSinceFebruary #WhatInvestmentSignalsDo13FFilingsReveal?
The screenshot displays a 1-day (1D) technical candlestick chart for SPACE/USDT on Binance. The current last traded price stands at $0.003242, reflecting an intraday decline of -18.64%. Following a sharp corrective downtrend from a previous peak near $0.004542, the asset recently rebounded from a low of $0.002592 via an aggressive green impulse candle before retracing to its current mid-range level.
24-Hour Range & Trading Volume
Over the past 24 hours, SPACE recorded a high of $0.004170 and a low of $0.003167. Market participation and liquidity remain robust, supported by a 24-hour trading volume of 9.11B SPACE and 32.41M USDT. An announcement ticker at the top also notes ongoing project updates, indicating that SpaceCoin and Midnight are collaborating on privacy messaging.
Technical Indicators (MACD & Moving Averages)
MACD: In the lower indicator panel, the MACD metrics show DIF: -0.000162, DEA: -0.000213, and MACD: 0.00051. The MACD histogram has transitioned into positive territory with green bars forming, and the DIF line has crossed above the DEA line, signaling a potential shift toward short-term bullish momentum. @Space #spaceusdt $SPACE
#CanNvidia’sDataCenterGrowthContinue? #NvidiaBoardNotConsideringHuang’sReturnasCEO #KOSPIFalls2.59%ToLowestCloseSinceFebruary #WhatInvestmentSignalsDo13FFilingsReveal?