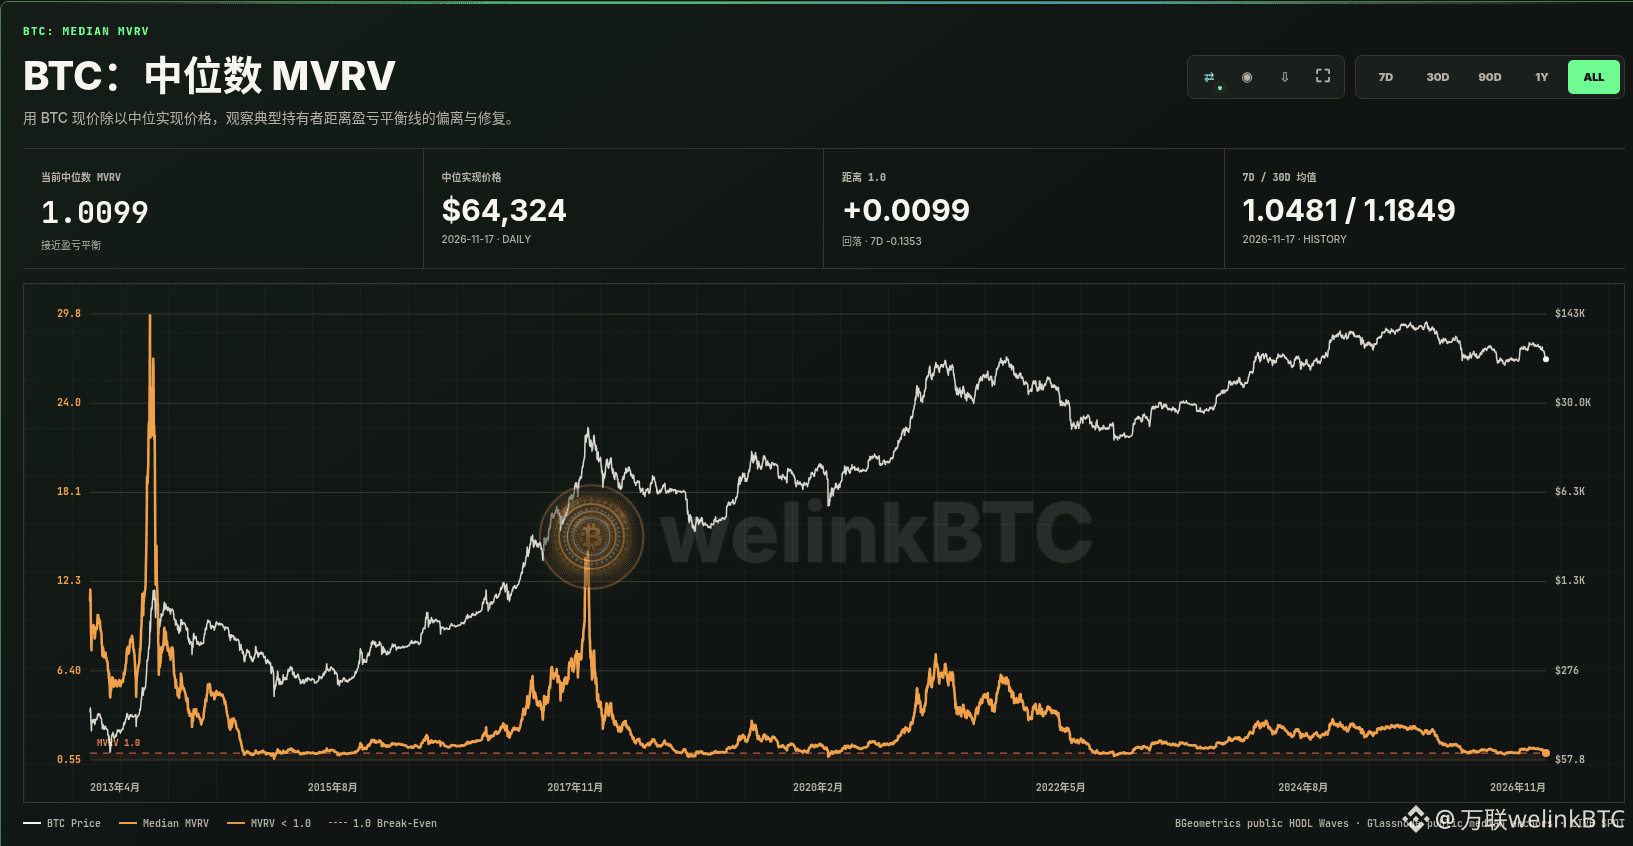
BTC: Median MVRV
The breakeven line for the typical holder is being tested, with median MVRV already close to 1.0.
As of 2026-11-17, median MVRV is 1.0099, just 0.99% above the 1.0 breakeven line; the median realized price is $64,324, and the BTC reference price is about $64,962. The 7-day average is 1.0481, the 30-day average is 1.1849, and the 7-day change is about -0.1353, with the short-term trend still declining.
How should you read this metric? Median MVRV is the current BTC price divided by the median realized price. The median realized price is the midpoint of the prices at which all BTC last moved on-chain. Compared with a traditional average, it is less likely to be distorted by large transfers from whales and better reflects the cost basis of a typical market participant.
A reading close to 1.0 means the price is near the cost basis of typical holders; a drop below 1.0 means that more than half of the supply is around breakeven or at a loss. Historical readings at several lows were: 0.55 in 2015 (about $152), 0.75 in 2018 (about $3,122), 0.998 in 2022 (about $17,600), and a local low of 1.008 in 2025 (about $60K). This shows that the threshold for a bottom changes as the market matures; it is not a fixed buy signal.
What’s more worth watching next is whether the ratio can stabilize back above 1.0, whether the 7-day average can continue to rise, and whether spot demand and liquidity follow through. The area near breakeven is better used as a long-term valuation reference than as a standalone timing signal.
More selected on-chain cycle indicators
Portal: https://welinkbtc-onchainmain.xyz/
Understand market cycles like a professional analyst
$BTC
The breakeven line for the typical holder is being tested, with median MVRV already close to 1.0.
As of 2026-11-17, median MVRV is 1.0099, just 0.99% above the 1.0 breakeven line; the median realized price is $64,324, and the BTC reference price is about $64,962. The 7-day average is 1.0481, the 30-day average is 1.1849, and the 7-day change is about -0.1353, with the short-term trend still declining.
How should you read this metric? Median MVRV is the current BTC price divided by the median realized price. The median realized price is the midpoint of the prices at which all BTC last moved on-chain. Compared with a traditional average, it is less likely to be distorted by large transfers from whales and better reflects the cost basis of a typical market participant.
A reading close to 1.0 means the price is near the cost basis of typical holders; a drop below 1.0 means that more than half of the supply is around breakeven or at a loss. Historical readings at several lows were: 0.55 in 2015 (about $152), 0.75 in 2018 (about $3,122), 0.998 in 2022 (about $17,600), and a local low of 1.008 in 2025 (about $60K). This shows that the threshold for a bottom changes as the market matures; it is not a fixed buy signal.
What’s more worth watching next is whether the ratio can stabilize back above 1.0, whether the 7-day average can continue to rise, and whether spot demand and liquidity follow through. The area near breakeven is better used as a long-term valuation reference than as a standalone timing signal.
More selected on-chain cycle indicators
Portal: https://welinkbtc-onchainmain.xyz/
Understand market cycles like a professional analyst
$BTC