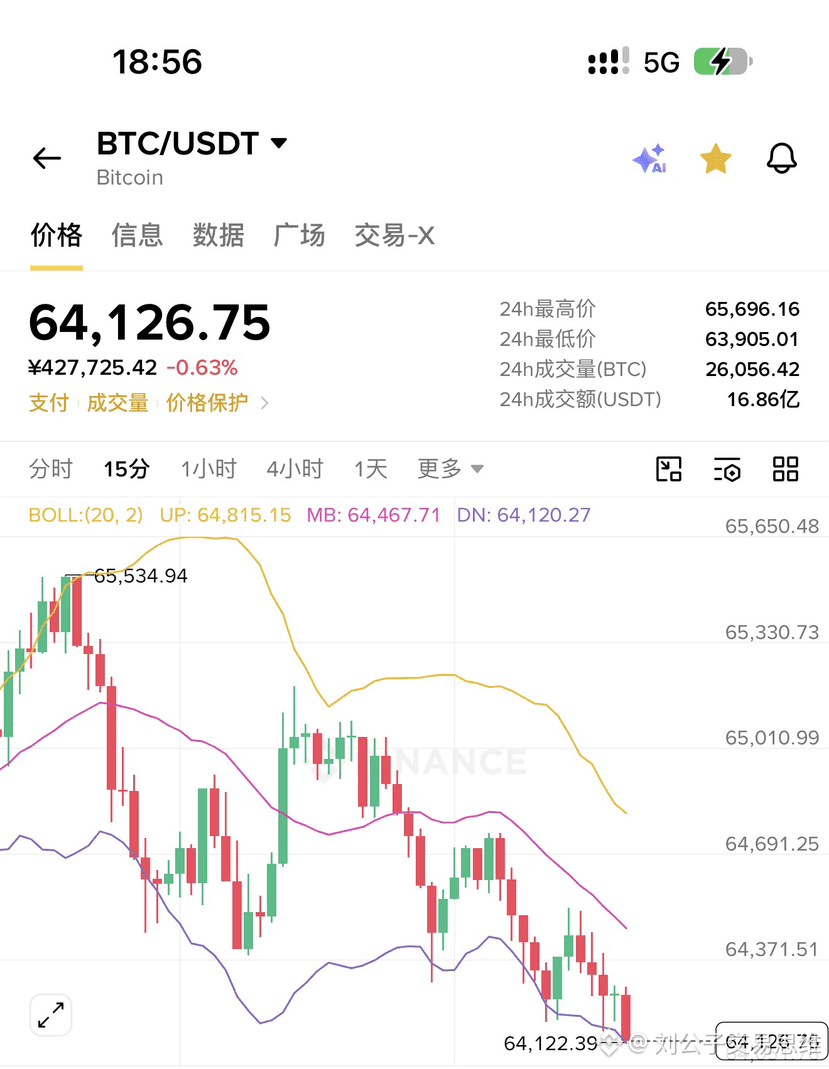
1BTC has remained weak recently, with the current price fluctuating around 64,400. It has fallen more than 13% over the past week, while the monthly correction is close to 21%. The price has dropped below short-term moving averages such as the 5-day and 21-day averages, and the daily chart structure is bearish.
Technically, the MACD fast line is below the slow line and the green histogram bars are extending, indicating that bearish momentum has yet to fully run its course. RSI(14) and Stochastic have entered oversold territory, but oversold does not mean a bottom has formed; any short-term rebound is more likely to be a corrective bounce within the downtrend. The Bollinger Bands are widening to the downside, with the price trading near the lower band, limiting room for a rebound.
The key resistance to watch above is around 65,450. Until the price holds above this level and reclaims the SMA5 (around 66,100), the trend should still be treated as bearish. Initial support below is at 63,880; if it breaks decisively, the price could test 63,000 and even the 60,000 level.
Technically, the MACD fast line is below the slow line and the green histogram bars are extending, indicating that bearish momentum has yet to fully run its course. RSI(14) and Stochastic have entered oversold territory, but oversold does not mean a bottom has formed; any short-term rebound is more likely to be a corrective bounce within the downtrend. The Bollinger Bands are widening to the downside, with the price trading near the lower band, limiting room for a rebound.
The key resistance to watch above is around 65,450. Until the price holds above this level and reclaims the SMA5 (around 66,100), the trend should still be treated as bearish. Initial support below is at 63,880; if it breaks decisively, the price could test 63,000 and even the 60,000 level.