
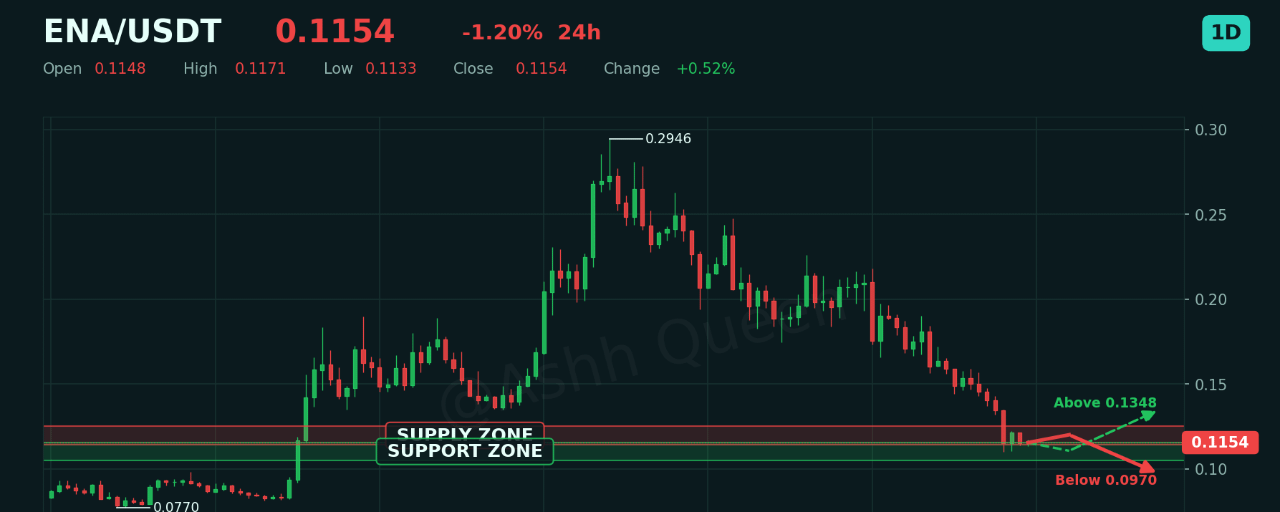

The current landscape for $ENA is defined by a complex interplay of conflicting signals, leaving market participants to navigate a period of notable uncertainty. With the asset currently priced at 0.1154, the immediate technical backdrop suggests a lack of clear directional momentum, forcing a closer look at the convergence of different timeframes. While the one-hour timeframe shows the price holding steady at the VWAP at 0.1154, a broader perspective reveals a more cautious environment, underscored by the daily RSI at 28.48, which remains in oversold territory. As we analyze the structure of the market, we must consider how the interaction between the daily EMA50 at 0.1709 and the local four-hour support at 0.1100 might influence future volatility. This article examines the current technical state of ENA by evaluating these critical thresholds, including the one-hour resistance at 0.1168, to provide a structured overview of what factors may dictate the next phase of price discovery.
📊 The Big Picture: $ENA on the Daily Chart
On the daily timeframe, the structure for ENA reflects a period of consolidation where the prevailing bearish bias is tempered by evidence of exhaustion. The asset currently trades at 0.1154, which sits significantly below the daily EMA50 at 0.1709 and the daily EMA200 at 0.1592. This positioning confirms that the broader trend remains under pressure, as the price has not yet managed to reclaim these key dynamic levels. However, the RSI at 28.48 currently signals an oversold condition, a technical state that patient market participants often monitor for signs of a potential stabilization or a shift in momentum.
While the price is hovering near the daily VWAP at 0.1153, the lack of positive MACD alignment suggests that the market is still searching for a definitive catalyst to shift the primary trend. For those observing the structural landscape, the proximity to the daily support1 at 0.1101 remains a critical area of interest. Should the asset maintain its position above this level, it may suggest that the current bearish intensity is fading, creating a more balanced environment for market participants to evaluate the next potential move toward the daily resistance1 at 0.1196. In this context, the daily chart serves as a reminder that patience remains essential until the asset can definitively overcome the overhead hurdles defined by its major moving averages.
⏱️ Four-Hour Structure and Momentum
On the four-hour timeframe, ENA is currently navigating a period of tempered momentum. The structure remains largely influenced by the positioning of key moving averages, as the current price of 0.1154 sits below the four-hour EMA50 at 0.1333 and the four-hour EMA200 at 0.1677. This alignment suggests that participants are observing a cautious environment where the asset struggles to reclaim higher ground. The four-hour RSI at 30.11 indicates a state of normal momentum, reflecting the lack of clear directional conviction in the near term.
When observing the volatility boundaries, the four-hour Bollinger Band lower level at 0.1122 provides a reference point for potential support, while the four-hour VWAP at 0.1157 remains just above the current price, acting as a dynamic threshold to monitor. Should the asset manage to stabilize, the four-hour resistance at 0.1351 becomes a focal point for assessing whether a shift in sentiment is underway. Conversely, if current levels fail to hold, the four-hour support at 0.1100 may see increased scrutiny. While the four-hour MACD is currently positive, the overall structure remains sensitive to the interplay between these established levels, leaving the market in a state of watchful consolidation.
🧭 The One-Hour Map: Levels That Matter Today
On the one-hour timeframe, ENA is currently navigating a tight corridor, with the one-hour price at 0.1154 showing a neutral bias as it struggles to establish a clear trend. A pivotal observation is the one-hour VWAP at 0.1154, which currently acts as a baseline for intraday activity. Since the current price sits exactly at this level, traders are likely watching for a definitive break or rejection. With the one-hour RSI at 45.18, the asset maintains a state of equilibrium, neither showing extreme exhaustion nor aggressive momentum.
Volatility, measured by the one-hour ATR at 0.00176546, remains relatively contained, suggesting that participants are currently waiting for a catalyst before committing to a larger move. If the asset maintains its position relative to the one-hour VWAP at 0.1154, market participants might look toward the one-hour resistance at 0.1168 as a potential ceiling. Conversely, should the price drift downward, the one-hour support at 0.1145 becomes a critical zone to monitor for signs of renewed interest. As the one-hour pivot at 0.1166 sits just above the current price, the immediate challenge for ENA is to reclaim this level to shift the short-term intraday sentiment toward a more constructive outlook.
📈 What the Derivatives Market Is Saying
The derivatives landscape for ENA currently presents a nuanced picture, reflecting the broader indecision seen in its spot price movements. With a 24-hour change of -1.20%, market participants appear to be maintaining a cautious stance. Specifically, the FUNDING at +0.0032% remains positive, which often suggests that long-positioned traders are willing to pay a premium to maintain their exposure, even as the asset faces resistance. This sentiment is paired with an OPENINTEREST at 514,715,528, a figure that highlights the significant capital committed to open contracts as the asset consolidates near its current levels.
While the OPENINTEREST at 514,715,528 indicates sustained engagement from traders, it is essential to observe how this interacts with the technical structure. When the FUNDING at +0.0032% stays in positive territory despite a mild downward drift, it can imply that the crowd is expecting a recovery rather than a deeper correction. However, one must remain humble when interpreting such data; elevated participation can just as easily lead to volatility if those positions are squeezed. The current positioning suggests that market participants are closely watching the interaction between current liquidity and the prevailing market trend, keeping the overall outlook delicately balanced.
🎯 Scenario Playbook: Bull, Base and Bear Cases
The current landscape for ENA presents a complex interplay of short-term stability and broader downward pressure. In our bull scenario, the focus shifts toward reclaiming lost ground on the 1h chart. For this to materialize, the price at 0.1154 must consistently hold above the one-hour VWAP at 0.1154 and break through the immediate one-hour resistance at 0.1168. A sustained move above this level could invite a test of higher zones, eventually looking toward the significant four-hour resistance at 0.1351. Bullish confirmation requires the price to overcome these clusters without retreating, supported by a constructive shift in the 4h MACD momentum.
The base case suggests a period of consolidation within the current range. Given that ENA is trading near the one-hour pivot at 0.1166, a lack of directional conviction might keep the price oscillating between the one-hour support at 0.1145 and the one-hour resistance at 0.1168. In this scenario, we monitor the interplay between the one-hour EMA20 at 0.1161 and the prevailing one-hour VWAP at 0.1154. If these levels remain tight and volume stays muted, the asset will likely continue its sideways drift, awaiting a catalyst to break the current equilibrium.
Finally, the bear scenario remains a risk if the price fails to defend established floors. A breach of the one-hour support at 0.1145 accompanied by a decline below the four-hour pivot at 0.1166 would likely accelerate downward momentum. If the price slips toward the four-hour support at 0.1100, traders will look to the daily RSI at 28.48, which is currently at 28.48, to see if oversold conditions provide a technical floor or if the trend continues toward the daily support at 0.1101. Invalidating this bearish outlook would require a decisive reversal above the one-hour resistance at 0.1168, shifting the focus back toward recovery.
🛡️ Risk Management and Account Security
Navigating market uncertainty requires a disciplined approach to risk management, especially when assets like ENA exhibit shifting momentum across various timeframes. Understanding volatility is the first step toward preserving capital; the four-hour ATR at 0.00422424 serves as a vital indicator of current price fluctuations, helping you gauge how much "room to breathe" an asset might need before a thesis is tested. Oversized positions often fall victim to minor market noise, making small, calculated position sizing essential for maintaining long-term sustainability. It is always wise to define your invalidation point—the moment your initial logic no longer holds—before considering any engagement with the market. Avoiding the allure of leverage is equally critical, as borrowed funds can transform standard volatility into significant account pressure, often leading to forced exits during routine pullbacks.
Beyond market mechanics, safeguarding your account security is the bedrock of any serious approach. Always prioritize the fundamentals: enable two-factor authentication, set up an anti-phishing code to verify official communications, and interact only through the official application. Never share your private keys or seed phrases with anyone under any circumstances, as these are the keys to your financial sovereignty. By combining a clear understanding of indicators like the four-hour ATR at 0.00422424 with rigorous security habits, you create a resilient environment that prioritizes capital preservation over reactive decision-making. How do you integrate volatility metrics into your own planning process when the market signals are mixed?
✅ Final Take
The current landscape for $ENA shows a distinct tension between short-term stability and broader bearish sentiment across higher timeframes. With the price at 0.1154, the market appears to be consolidating near the one-hour VWAP at 0.1154, while facing clear resistance from the one-hour EMA20 at 0.1161. The daily RSI at 28.48 highlights an oversold condition that warrants attention, yet the failure to reclaim the four-hour EMA50 at 0.1333 suggests that buyers are not yet in control. If the price remains above the one-hour support at 0.1145, we may see a drift toward the daily resistance at 0.1196. Conversely, a breach below the four-hour support at 0.1100 could shift the focus toward the lower daily support levels. How do you interpret the current lack of momentum near 0.1154 in the context of these oversold indicators?
#ENA #TechnicalAnalysis #Altcoins
Risk note: leverage magnifies losses. Plan the exit before the entry.