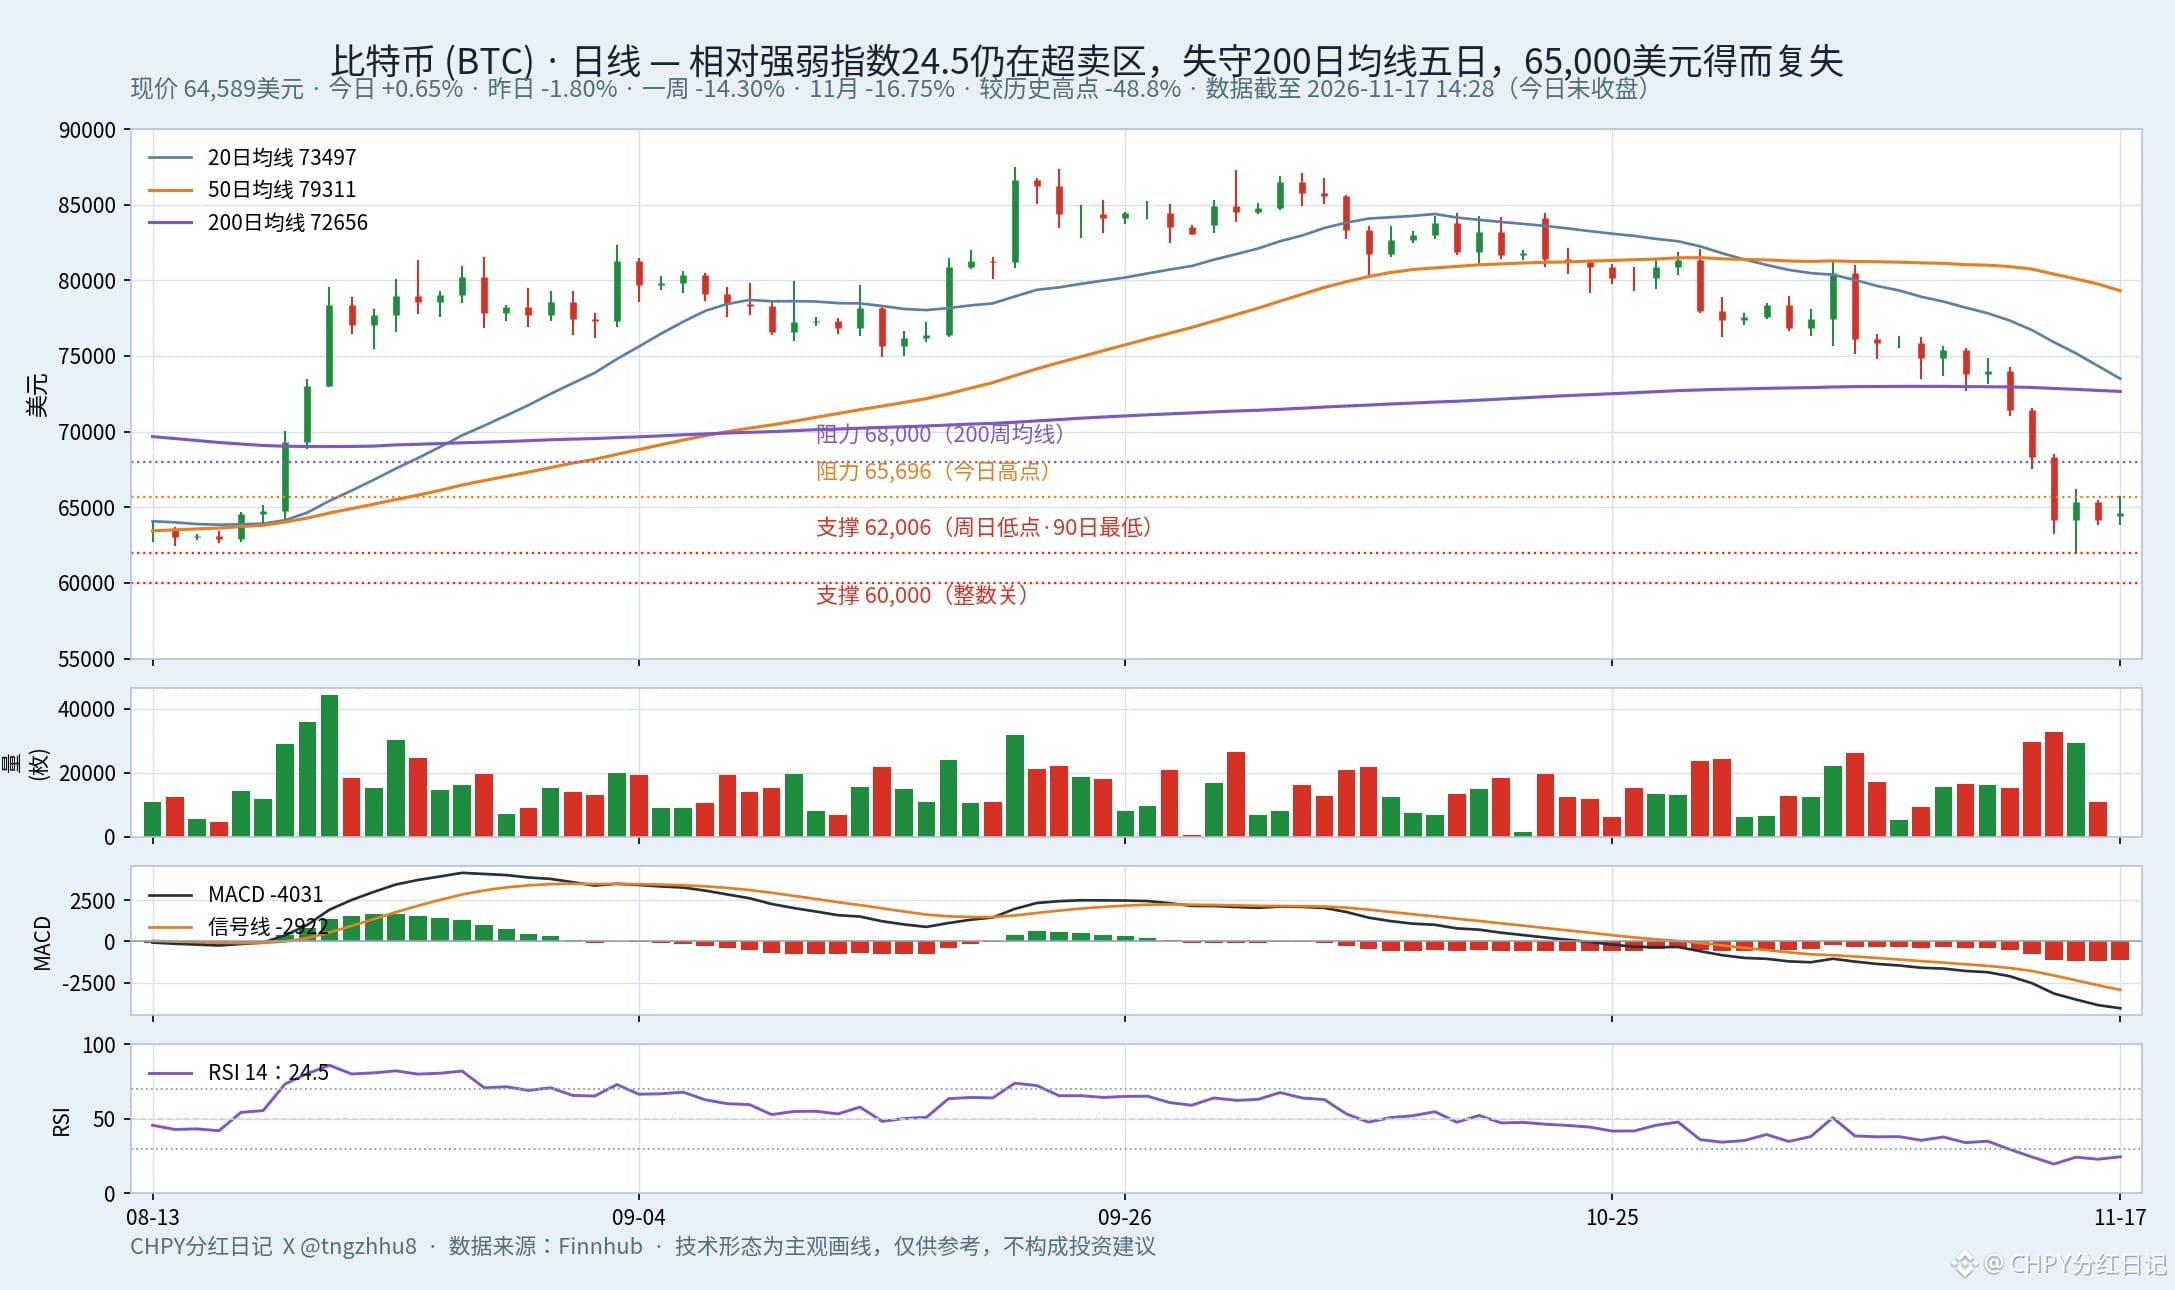
Bitcoin has been hovering below $65,000 for two days. It climbed as high as $65,696 this morning, only to be pushed back down. It’s now at $64,589 (as of 14:28 Beijing time; today’s session is still underway). Yesterday it closed at $64,174, down 1.80% for the day and 6.06% from last Friday’s close. It’s down 14.30% for the week and 16.75% in November, and 48.8% below its all-time high of $126,080. Sunday’s low of $62,006 was the lowest in three months and the lowest in 90 days.
Let’s start with three sets of technical indicators. The 14-day Relative Strength Index is 24.5, in oversold territory below 30. In plain English: down days have overwhelmingly outnumbered up days over the past 14 days, and bearish momentum has yet to fade. Oversold just means the drop has been sharp; it doesn’t mean the bottom is in. On November 14, the RSI briefly fell to 19.6. The 20-day moving average ($73,497), 50-day moving average ($79,311), and 200-day moving average ($72,656) are all overhead. The current price is 11.10% below the 200-day moving average, and Bitcoin has closed below it for five consecutive sessions. The 200-day moving average is the average closing price over the past 200 trading days; until Bitcoin climbs back above it, the market remains bearish. MACD is -4,031, with a histogram reading of -1,109, still below the zero line. In plain English: the short-term moving average is pulling farther away from the long-term one, and downward momentum has yet to ease. The histogram’s negative reading narrowed slightly today.
Trading volume is also worth a look. On November 14, the day of the sharp sell-off, volume reached 32,675 BTC—2.08 times the 30-day average—as investors rushed to sell in a panic. On November 16, volume dropped to 10,816 BTC. Selling pressure eased, but buyers weren’t eager to step in either.
The picture is even bleaker on the money-flow front. Spot Bitcoin exchange-traded funds have seen net outflows for 13 consecutive trading days, totaling about $2.35 billion over two weeks. They saw another $68.51 million flow out on November 16, and net inflows for 2026 turned negative for the first time. Whales’ holdings fell by about 50,000 BTC in a week, from roughly 13.73 million to 13.68 million. The options market’s largest position is in put options with a $60,000 strike price, with a notional value of about $900 million—suggesting the market sees $60,000 as the next line of defense. The Crypto Fear & Greed Index is at 12, marking its fifth consecutive day in extreme fear territory. Ethereum at $1,813.68 and Solana at $71.52 were also languishing near their lows this morning.
Here are the levels to watch: the first resistance above is $65,696 (today’s high). Only a move above that would put $68,000 (the 200-week moving average) in play. The first support below is $62,006 (Sunday’s low), followed by the round-number level of $60,000. Nansen says the $60,000–$62,600 range will be a key test over the coming weeks.
To put it boldly: oversold conditions create room for a bounce, but don’t provide a reason for one. Nvidia reports its third-quarter results after the market closes tonight, and U.S. retail sales data are also due. If both variables come in favorably and risk appetite recovers, Bitcoin would need to break above $65,696 before a rebound is worth discussing. If either earnings or the data disappoints, $62,006 will be tested again; a break below that level would put $60,000 in focus. There are two key risks: first, if money keeps flowing out of spot ETFs, any bounce should initially be viewed as an oversold recovery. Second, Bitcoin has posted five consecutive down weeks, including a 9.93% drop in the week ending November 13. Until the trend turns, there may be another low below the current one. The technical analysis is subjective and for reference only; it does not constitute investment advice.
#比特币 #Technical Analysis
$BTC $ETH $NVDA
Let’s start with three sets of technical indicators. The 14-day Relative Strength Index is 24.5, in oversold territory below 30. In plain English: down days have overwhelmingly outnumbered up days over the past 14 days, and bearish momentum has yet to fade. Oversold just means the drop has been sharp; it doesn’t mean the bottom is in. On November 14, the RSI briefly fell to 19.6. The 20-day moving average ($73,497), 50-day moving average ($79,311), and 200-day moving average ($72,656) are all overhead. The current price is 11.10% below the 200-day moving average, and Bitcoin has closed below it for five consecutive sessions. The 200-day moving average is the average closing price over the past 200 trading days; until Bitcoin climbs back above it, the market remains bearish. MACD is -4,031, with a histogram reading of -1,109, still below the zero line. In plain English: the short-term moving average is pulling farther away from the long-term one, and downward momentum has yet to ease. The histogram’s negative reading narrowed slightly today.
Trading volume is also worth a look. On November 14, the day of the sharp sell-off, volume reached 32,675 BTC—2.08 times the 30-day average—as investors rushed to sell in a panic. On November 16, volume dropped to 10,816 BTC. Selling pressure eased, but buyers weren’t eager to step in either.
The picture is even bleaker on the money-flow front. Spot Bitcoin exchange-traded funds have seen net outflows for 13 consecutive trading days, totaling about $2.35 billion over two weeks. They saw another $68.51 million flow out on November 16, and net inflows for 2026 turned negative for the first time. Whales’ holdings fell by about 50,000 BTC in a week, from roughly 13.73 million to 13.68 million. The options market’s largest position is in put options with a $60,000 strike price, with a notional value of about $900 million—suggesting the market sees $60,000 as the next line of defense. The Crypto Fear & Greed Index is at 12, marking its fifth consecutive day in extreme fear territory. Ethereum at $1,813.68 and Solana at $71.52 were also languishing near their lows this morning.
Here are the levels to watch: the first resistance above is $65,696 (today’s high). Only a move above that would put $68,000 (the 200-week moving average) in play. The first support below is $62,006 (Sunday’s low), followed by the round-number level of $60,000. Nansen says the $60,000–$62,600 range will be a key test over the coming weeks.
To put it boldly: oversold conditions create room for a bounce, but don’t provide a reason for one. Nvidia reports its third-quarter results after the market closes tonight, and U.S. retail sales data are also due. If both variables come in favorably and risk appetite recovers, Bitcoin would need to break above $65,696 before a rebound is worth discussing. If either earnings or the data disappoints, $62,006 will be tested again; a break below that level would put $60,000 in focus. There are two key risks: first, if money keeps flowing out of spot ETFs, any bounce should initially be viewed as an oversold recovery. Second, Bitcoin has posted five consecutive down weeks, including a 9.93% drop in the week ending November 13. Until the trend turns, there may be another low below the current one. The technical analysis is subjective and for reference only; it does not constitute investment advice.
#比特币 #Technical Analysis
$BTC $ETH $NVDA