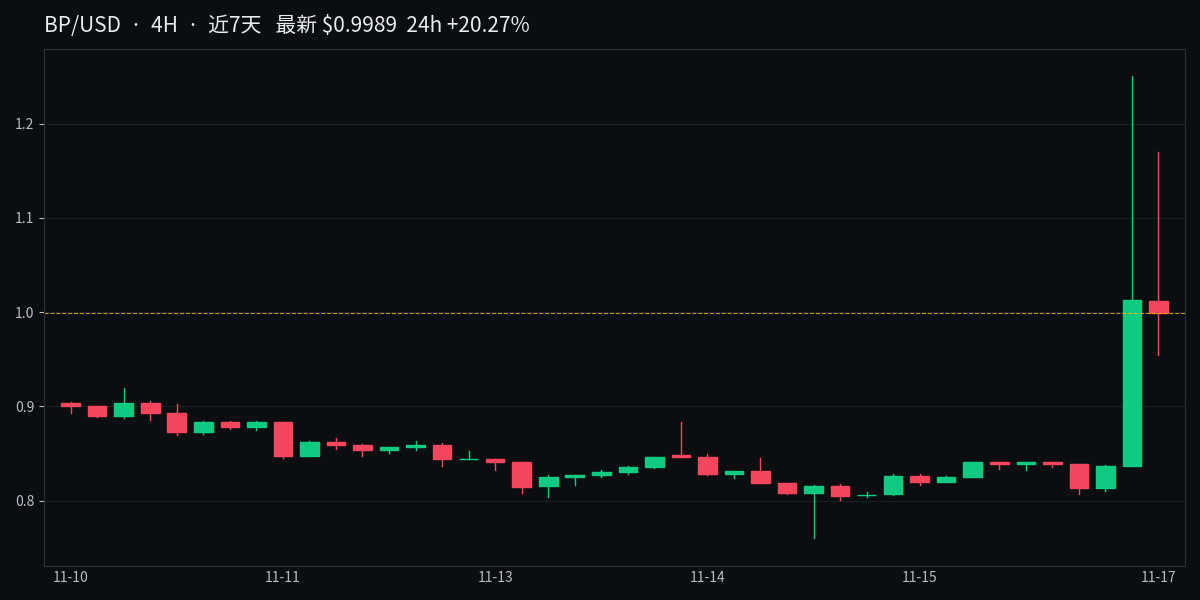
#BP This is a pretty classic pattern. Let’s look at the chart first:
For the past few days, it had been moving sideways between 0.81 and 0.85, grinding there for almost a week. Today, one 4H candle shot straight up to 1.25, and the next touched 1.17. It failed to hold both times and pulled back to hover around 1.00.
This looks like a breakout-and-retest setup: 0.85 was the top of the previous range, and after the breakout it became support. There’s another hurdle at 0.95 below; if that doesn’t hold, price will have to revisit 0.85 for another test.
The indicators are pretty mixed too: MA7 at 0.88 is above MA25 at 0.84, MACD has just turned positive, and volume has jumped more than sixfold over the past two days. Previously, daily volume was only around $3–6 million. But RSI is already overbought at 80.6, and price is still above the upper Bollinger Band at 0.96, so chasing it here could be risky.
If it holds above 1.00, the next levels to watch are 1.17–1.25. If it loses 0.95, look first to 0.85. Don’t rush to a conclusion. $BP
For the past few days, it had been moving sideways between 0.81 and 0.85, grinding there for almost a week. Today, one 4H candle shot straight up to 1.25, and the next touched 1.17. It failed to hold both times and pulled back to hover around 1.00.
This looks like a breakout-and-retest setup: 0.85 was the top of the previous range, and after the breakout it became support. There’s another hurdle at 0.95 below; if that doesn’t hold, price will have to revisit 0.85 for another test.
The indicators are pretty mixed too: MA7 at 0.88 is above MA25 at 0.84, MACD has just turned positive, and volume has jumped more than sixfold over the past two days. Previously, daily volume was only around $3–6 million. But RSI is already overbought at 80.6, and price is still above the upper Bollinger Band at 0.96, so chasing it here could be risky.
If it holds above 1.00, the next levels to watch are 1.17–1.25. If it loses 0.95, look first to 0.85. Don’t rush to a conclusion. $BP