Bitcoin is showing signs of finding a short-term bottom. Could it skyrocket?❓
Nov 17 $BTC Comprehensive Market Analysis
💥 News:
Fed rate-hike expectations remain elevated: The probability of a rate hike in December is still around 85%–92%. A strong dollar and high Treasury yields continue to weigh on risk assets.
Key events this week: The FOMC meeting minutes will be released on November 18, alongside macroeconomic and tech-stock catalysts such as Nvidia’s earnings report.
💥 Fund flows:
U.S. spot Bitcoin ETFs continue to see heavy net outflows: Combined outflows over the past two weeks were about $235 million. Cumulative outflows so far in November have exceeded $200 million, with BlackRock’s IBIT accounting for most of them.
There was still a net outflow of about $185M on November 13, and the outflow trend has not reversed.
Stablecoin supply is shrinking and on-chain buying power is weakening, amplifying selling pressure.
💥 Sentiment:
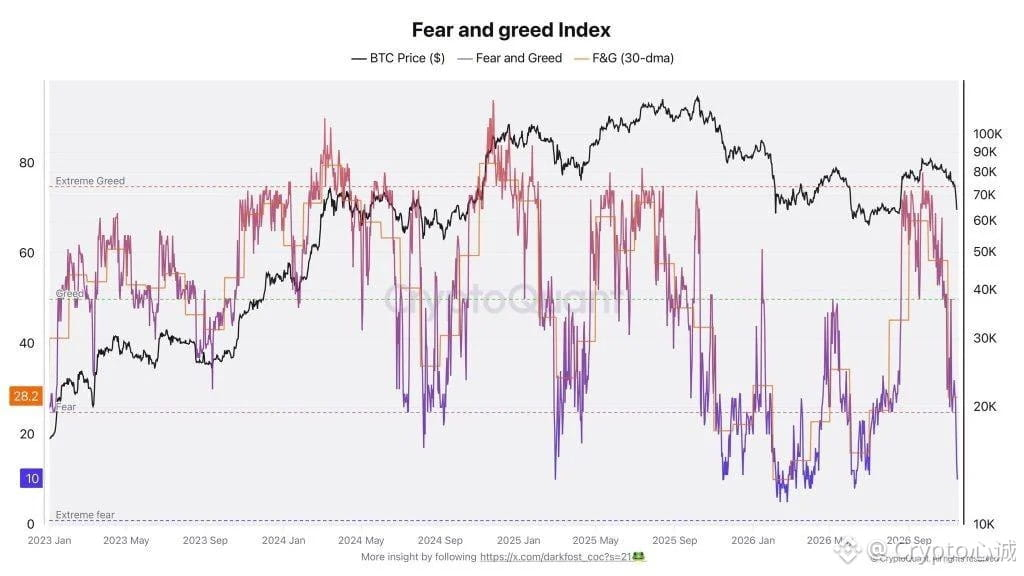
Today’s Fear and Greed Index is at 13, indicating extreme fear.
💥 Technical analysis:
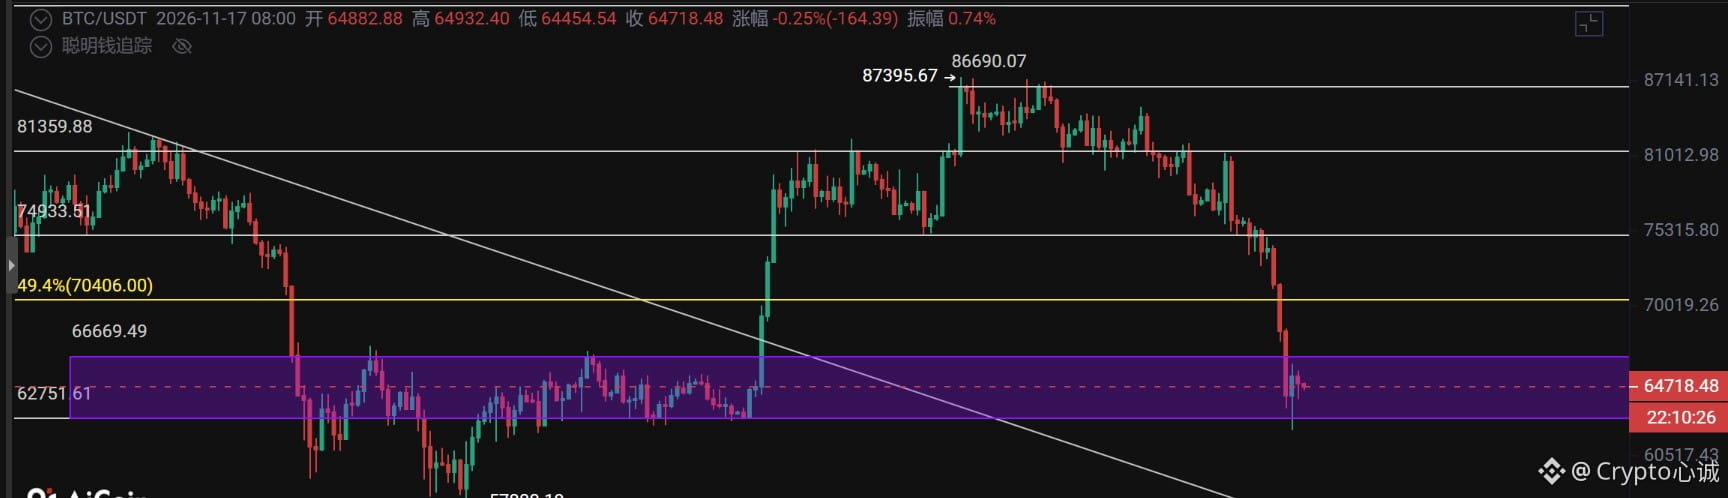
I think the price has found a bottom at this level on the smaller timeframes. It is currently moving sideways in the 62,700–66,700 range. However, the broader trend has not fully bottomed out yet. In my view, there could be a rebound from here. Watch to see whether the price can break through 66,700. On the daily chart, the MACD may rebound toward the zero line. After the rebound, the price could move down again in another declining leg.
So, based on the above, the short-term outlook is mainly range-bound, with support at 62,800–60,800 and resistance at 66,700–65,600.
$BTC
#黄仁勋能否复任CEO?英伟达董事会:暂不考虑
Nov 17 $BTC Comprehensive Market Analysis
💥 News:
Fed rate-hike expectations remain elevated: The probability of a rate hike in December is still around 85%–92%. A strong dollar and high Treasury yields continue to weigh on risk assets.
Key events this week: The FOMC meeting minutes will be released on November 18, alongside macroeconomic and tech-stock catalysts such as Nvidia’s earnings report.
💥 Fund flows:
U.S. spot Bitcoin ETFs continue to see heavy net outflows: Combined outflows over the past two weeks were about $235 million. Cumulative outflows so far in November have exceeded $200 million, with BlackRock’s IBIT accounting for most of them.
There was still a net outflow of about $185M on November 13, and the outflow trend has not reversed.
Stablecoin supply is shrinking and on-chain buying power is weakening, amplifying selling pressure.
💥 Sentiment:
Today’s Fear and Greed Index is at 13, indicating extreme fear.
💥 Technical analysis:
I think the price has found a bottom at this level on the smaller timeframes. It is currently moving sideways in the 62,700–66,700 range. However, the broader trend has not fully bottomed out yet. In my view, there could be a rebound from here. Watch to see whether the price can break through 66,700. On the daily chart, the MACD may rebound toward the zero line. After the rebound, the price could move down again in another declining leg.
So, based on the above, the short-term outlook is mainly range-bound, with support at 62,800–60,800 and resistance at 66,700–65,600.
$BTC
#黄仁勋能否复任CEO?英伟达董事会:暂不考虑