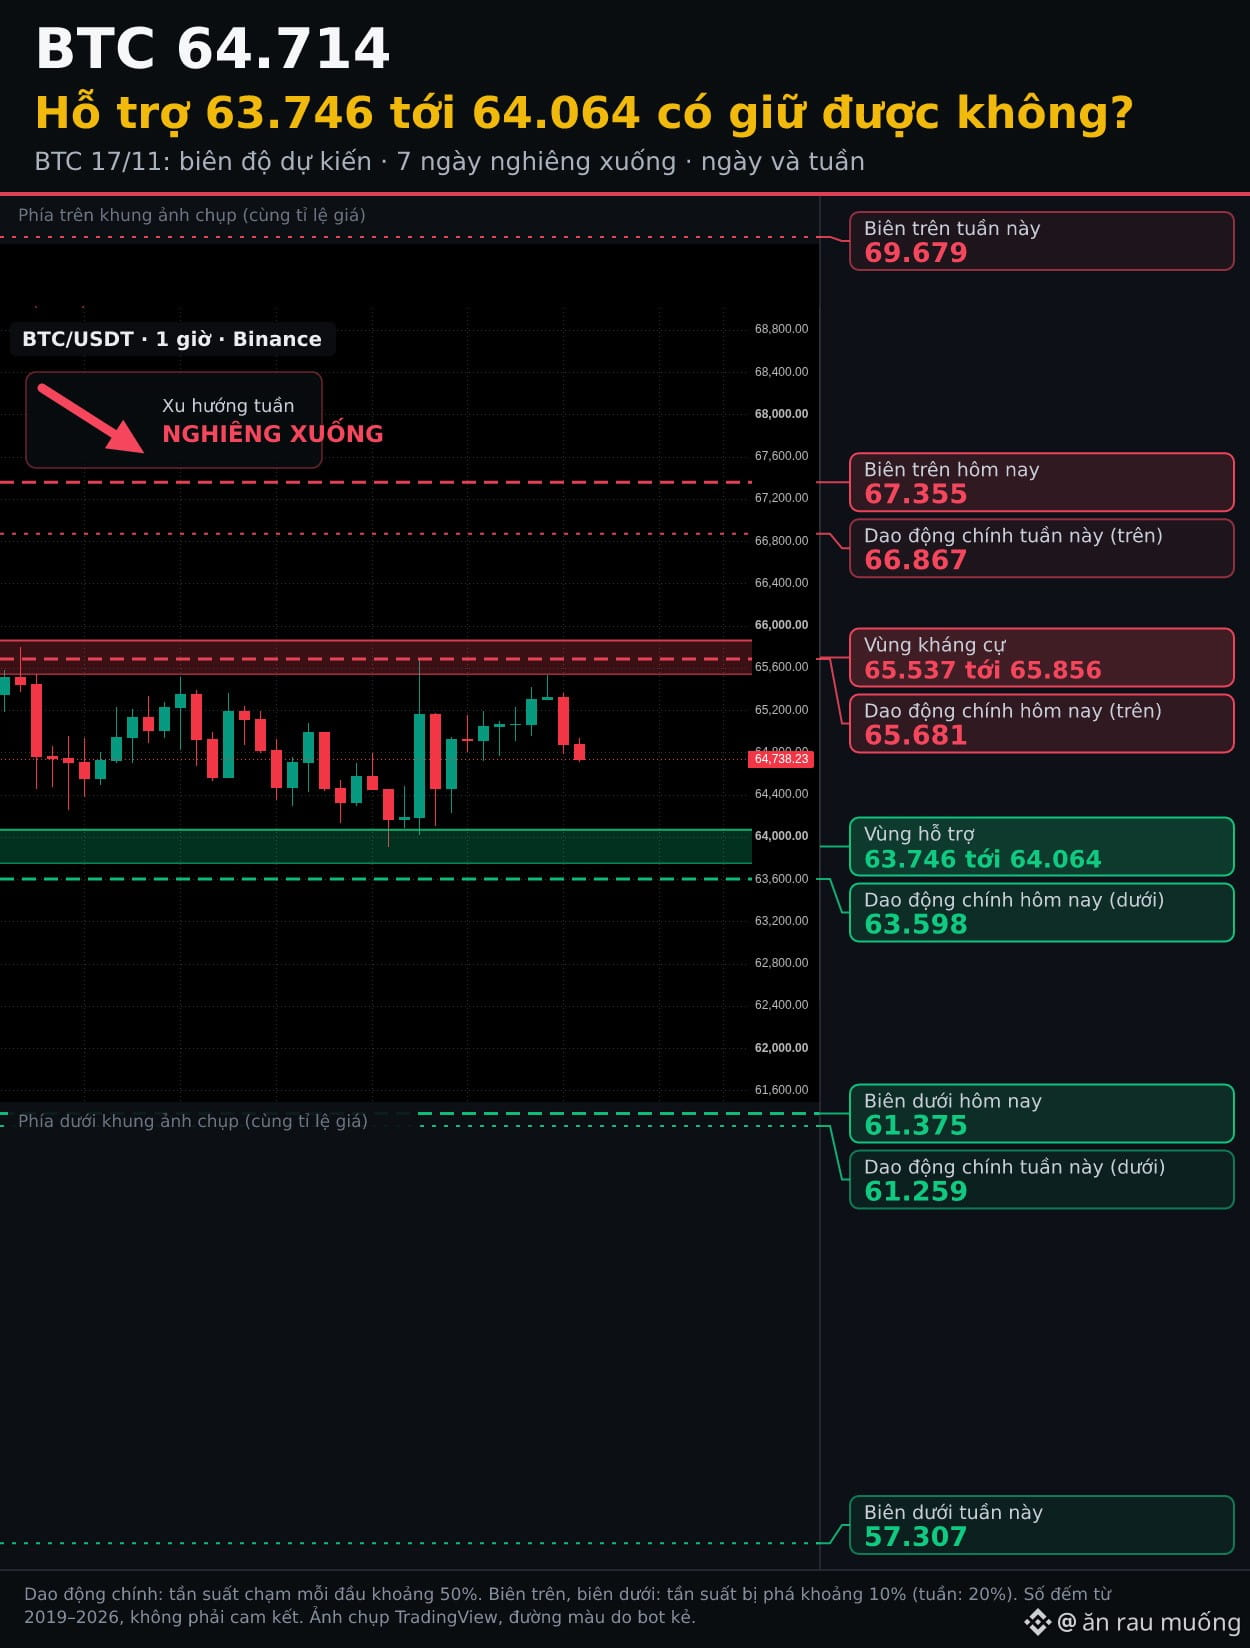
I’m looking at this week’s BTC trend: $BTC 64.714, and I don’t see a reason to be optimistic yet.
Of the 17 signals I track, 4 are bearish and 2 are bullish.
The key level is the 65.537 to 65.856 resistance zone. As long as price stays below it, sellers have the advantage. If it decisively breaks above 69.679, I’ll abandon this view.
Here’s why:
• Stablecoin supply contracted 1.51% over 7 days, meaning some money is leaving the market.
• Fed liquidity is flat (−0.5% over 4 weeks).
• 72% of accounts on Binance Futures are still long, with the crowd all leaning one way.
• ETFs saw net outflows of $1.07 billion over the last 5 sessions, meaning US institutions are selling.
On the other hand:
• Price has just been sold off heavily (−0.7% over 24 hours, −13.9% over 7 days); after drops like these, BTC often bounces.
• The VIX just changed by −25% in 5 sessions.
I checked historical data: since 2019, there have been 228 days like this, and BTC was lower after a week 58% of the time (normally 47%). I have less confidence than usual this time, because the signals currently flashing are among those that have weakened over the past three years.
🛡 Is anyone supporting the price? Not seeing it—the signs lean toward selling: in similar cases, the price fell by at least another 8% over the following week 45% of the time (normally 31%).
📍 Today (Tuesday 17/11), expected range:
• Main trading range: 63.598 to 65.681.
• Upper bound 67.355, lower bound 61.375.
📆 For the full week, expected range:
• Main trading range: 61.259 to 66.867.
• Upper bound 69.679, lower bound 57.307.
🧱 Resistance and support zones, with the probability that price will reach and decisively break through them within 7 days:
• Resistance 65.537 to 65.856: 74% chance of being reached, 42% chance of a decisive break above
• Support 63.746 to 64.064: 86% chance of being reached, 61% chance of a decisive break below
🧭 Trend-following trades: short only. Intraday: take profit around 63.598, stop loss above 67.355. Holding for the week: take profit around 61.259, stop loss above 69.679.
⚠️ When would I be wrong? If funding turns negative, money starts leaving exchanges, or price decisively breaks above 69.679.
The percentages above are statistics based on BTC data from 2019 to 2026—not promises or investment advice. Manage your risk before entering a trade.
#BTC #Bitcoin
Of the 17 signals I track, 4 are bearish and 2 are bullish.
The key level is the 65.537 to 65.856 resistance zone. As long as price stays below it, sellers have the advantage. If it decisively breaks above 69.679, I’ll abandon this view.
Here’s why:
• Stablecoin supply contracted 1.51% over 7 days, meaning some money is leaving the market.
• Fed liquidity is flat (−0.5% over 4 weeks).
• 72% of accounts on Binance Futures are still long, with the crowd all leaning one way.
• ETFs saw net outflows of $1.07 billion over the last 5 sessions, meaning US institutions are selling.
On the other hand:
• Price has just been sold off heavily (−0.7% over 24 hours, −13.9% over 7 days); after drops like these, BTC often bounces.
• The VIX just changed by −25% in 5 sessions.
I checked historical data: since 2019, there have been 228 days like this, and BTC was lower after a week 58% of the time (normally 47%). I have less confidence than usual this time, because the signals currently flashing are among those that have weakened over the past three years.
🛡 Is anyone supporting the price? Not seeing it—the signs lean toward selling: in similar cases, the price fell by at least another 8% over the following week 45% of the time (normally 31%).
📍 Today (Tuesday 17/11), expected range:
• Main trading range: 63.598 to 65.681.
• Upper bound 67.355, lower bound 61.375.
📆 For the full week, expected range:
• Main trading range: 61.259 to 66.867.
• Upper bound 69.679, lower bound 57.307.
🧱 Resistance and support zones, with the probability that price will reach and decisively break through them within 7 days:
• Resistance 65.537 to 65.856: 74% chance of being reached, 42% chance of a decisive break above
• Support 63.746 to 64.064: 86% chance of being reached, 61% chance of a decisive break below
🧭 Trend-following trades: short only. Intraday: take profit around 63.598, stop loss above 67.355. Holding for the week: take profit around 61.259, stop loss above 69.679.
⚠️ When would I be wrong? If funding turns negative, money starts leaving exchanges, or price decisively breaks above 69.679.
The percentages above are statistics based on BTC data from 2019 to 2026—not promises or investment advice. Manage your risk before entering a trade.
#BTC #Bitcoin