
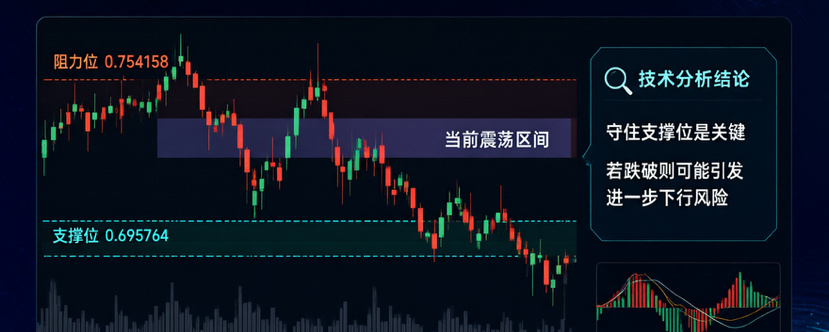

On the day the extreme-fear reading appeared, most people were calculating their losses, while SUI quietly turned green. The Fear and Greed Index fell to 11 on November 15 and stayed at 10 on the 16th, in the “extreme fear” zone, compared with a reading of 64 a month earlier. Amid this sentiment, SUI rebounded about 1.6% from its lows, despite still being down more than 13% over seven days. I’d rather treat this divergence—“sentiment bottoms, price moves first”—as an early clue than a signal to buy the dip.
I. Broader market backdrop: SUI’s rebound happened amid the wreckage
First, let’s take a clear look at the conditions in which the rebound took place. Last weekend, the crypto market saw a cascade of liquidations. Bitcoin dipped to a low of $62,000 on Saturday night, breaking below its 200-day moving average at around $73,000 and triggering a wave of long liquidations, before recovering to above $64,000. In the early hours of November 17, BTC was fluctuating around $65,000. More concerning is the state of fund flows: Bitcoin has fallen about 4.4% below its 200-week moving average, while IBIT saw net outflows of $2.92 billion over the past 30 days, about 57% of which came in the final seven days.
In other words, SUI's rebound this time isn't "a rising tide lifting all boats"; it's an isolated move while major assets are still bleeding. There are two explanations for an isolated move: real capital is stepping in at specific price levels, or it's merely a technical bounce caused by short sellers taking profits and closing positions. Distinguishing between these two is what this article is about.
II. An 86% Drawdown: Historically Extreme Fear, but History Never Repeats
SUI's all-time high was $5.35. It is currently trading in the $0.71–$0.72 range, down approximately 86.6% from its ATH, with a market cap of about $2.97 billion. This drawdown is already at a historically extreme level of fear.
Historically, this kind of level has often led to one of two outcomes: either valuation continues to contract until fundamentals deliver a rescue, or the price first stabilizes and recovers sideways, then rises again on new capital. What makes this cycle more complicated is that SUI hasn't fallen solely because of macroeconomic forces. Its seven-day decline is about 15.2%, its 30-day decline about 26.7%, and its year-to-date decline about 49%. The pattern of losses reflects both beta and erosion of alpha within its own ecosystem.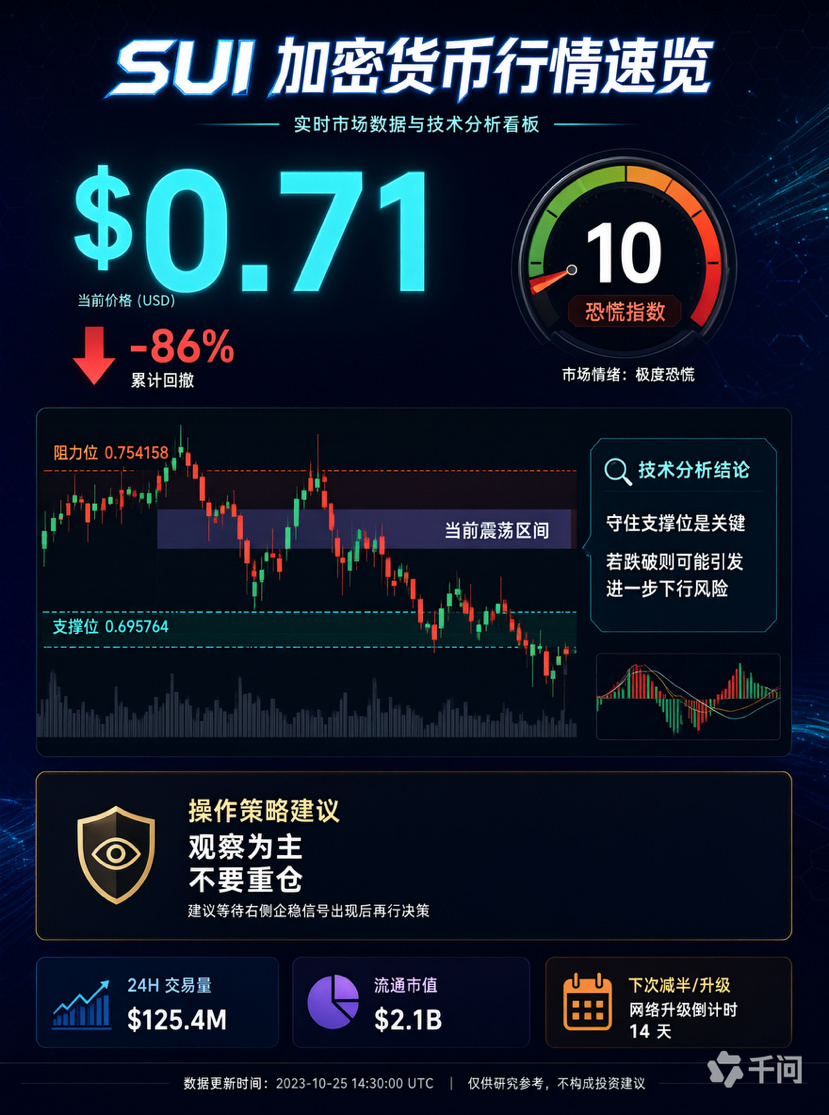
III. Trading Volume Exceeds 5% of Market Cap: This Signals Disagreement, Not Consensus
The observation raised by the user—that "trading volume exceeds 5% of market cap"—is important, but it needs to be unpacked. High turnover near the end of a decline may mean that trading has run its course and tokens have changed hands; it may also mean that selling pressure keeps being absorbed, only for more tokens to be sold again.
Order-book data points to a more sober picture: SUI's funding rate is negative (about -0.0023%), open interest is slightly up, mainly due to newly opened short positions, and spot markets saw net selling of about $1.815 million over 24 hours. Liquidations totaled only about $406,000. In plain English: leveraged traders are adding short positions, spot markets are seeing net outflows, and liquidations are far too small to amount to a "short squeeze." This combination looks more like "low-level turnover plus short positioning" than "aggressive accumulation by whales."
So, for now, the claim that "buyers are stepping in" can only be called "not disproven," not "confirmed." Evidence that would truly confirm buyers are stepping in includes sustained growth in aggressive spot buying, a shift to positive funding rates, and open interest rising in tandem with price—not price and open interest rising while spot markets see net outflows.
IV. Are On-Chain Whales Quietly Accumulating? The Evidence Isn't There Yet
I wouldn't pass off trading volume as on-chain evidence. To determine whether whales are accumulating, at least three things need to happen at the same time: exchange balances keep declining, token holdings become more concentrated across addresses, and net inflows persist for multiple consecutive days—ideally alongside growth in ecosystem usage.
The current on-chain picture is divided. On one side, there's contraction: Sui's DeFi TVL was about $392 million on November 14, down another 3.23% in a single day; ecosystem wallet providers have been exiting one after another, with Suiball shutting down on November 10 and the native browser wallet Suiet ending maintenance after November 14. More strikingly, active users fell from about 601,000 in November 2025 to about 128,000 in October 2026, a drop of nearly 80%, while transaction counts continued to rise.
On the other side, there's expansion: the supply of stablecoins on Sui has recently grown by about 10% to $538 million; Samsung Wallet has integrated USDC on the Sui network, initially for Galaxy users in the US, with potential reach across about 82 million devices; and Verifiable Agent Arbiter, developed in partnership with Google Cloud, has launched, providing an auditable compliance layer for AI agent behavior.
These contradictions show that the network is alive in the areas of "payments and stablecoins," while the token's valuation anchor is "users and TVL." More people using Sui and more people buying SUI are two different curves.
V. Technical Analysis: 0.695764 Is the Bulls' Lifeline
Viewed within a technical framework, the logic behind the two price levels provided by the user is sound.
Support: 0.695764 is the zone that short-term bulls must defend. A break below it would suggest that "buyers stepping in" may have been no more than a short-term bounce. Below that is the 0.6726 level identified by institutional models as a near-term risk threshold. Further down lies a potential valuation reset in the historical lows region.
Resistance: 0.754158 is the first rebound target, corresponding to a previous high-volume trading zone. More significant resistance lies around 0.7306 (the Ichimoku baseline) and 0.7594. The institutional model's short-term trading range is precisely 0.6726 to 0.7594, with the probability of further downside judged to be higher than that of an upside move. On the daily chart, SUI remains about 16.5% below its 200-day moving average, and 30-day volatility is as high as 80%, indicating that the medium-term trend has not turned bullish and that the rebound is a correction after oversold conditions.
Conclusion: The price structure is "consolidation at low levels within a downtrend." If 0.695764 holds, the rebound may have a chance to reach 0.754158; if it breaks below 0.695764 on rising volume, the 86% drawdown could very well deepen further.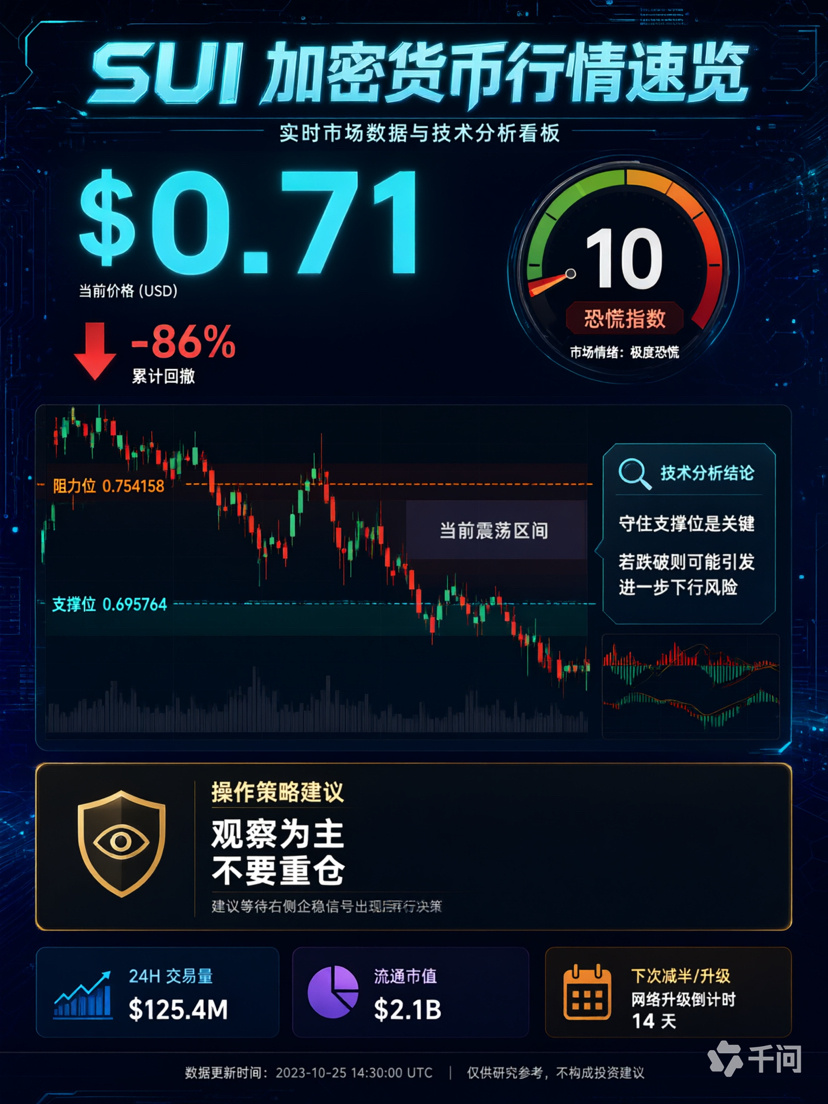
VI. Trading Strategy: Separate "Watching" from "Betting"
Core principle: This is a window for observation, not for taking large positions. An extreme fear reading offers a probability, not an edge.
Bullish approach (early entry, small position): Consider a small long position only if price stabilizes above 0.695764 on declining volume, then reclaims the 0.73–0.75 range on rising volume, while spot flows turn net positive and the funding rate moves from negative to positive. Place the stop-loss below 0.685 (the buffer zone between support and the institutional threshold). The first target is 0.754, and the second is the moving-average resistance around 0.80. This is a rebound trade, so the position must be significantly smaller than a trend-following position.
Bearish approach (confirmation, trend-following): If price rebounds to around 0.75, stalls at resistance, and volume does not increase, consider a small short position, with a stop-loss above 0.765. The initial target is 0.70, followed by 0.6726 if support breaks. If the daily chart loses 0.695764 on rising volume, consider adding to shorts in the direction of the trend—but make the decision on the day of the breakdown; don't chase shorts during a rebound.
Spot and long-term investing: If you believe in Sui's long-term plans for stablecoin payments and the agent economy, you can participate through staged purchases over time, building a position in tiers across the 0.60–0.75 range. Keep the first purchase to no more than 30% of your intended position and retain cash in case of an extreme drop below 0.67. Don't use leverage for long-term investing: with SUI's 30-day volatility around 80%, leverage will get repeatedly shaken out.
Event timing: SUI has regular monthly unlocks. On November 1, about 13.15 million tokens were released, equivalent to 0.32% of the supply released so far. The larger overhang is the roughly 6 billion tokens still awaiting release. Consider proactively reducing exposure around unlocks and Federal Reserve rate-decision windows.
VII. Risk Analysis: Four Real Downside Factors
First, the supply overhang. About 4.14 billion tokens are in circulation, with nearly 60% of the total supply still to be unlocked. Demand-side figures, such as ETF demand, are measured in millions of tokens, while supply-side figures are measured in billions. This mismatch in scale is a structural reason for long-term valuation pressure.
Second, negative ecosystem feedback. Declining TVL, wallet providers exiting, and a sharp drop in active users reinforce one another, continually weighing on the narrative premium of a "leading layer-1 blockchain." The market is also pricing in network reliability: Sui experienced four outages in 2026, with about 22 hours of total downtime.
Third, weak value capture by the token. Positive developments such as Samsung Wallet support USDC only in the initial phase, and gas-free transactions mean users don't need to hold SUI to pay fees. This has not directly created demand to buy the SUI token. Payment-focused blockchains generally face the challenge that "network success does not necessarily benefit the token."
Fourth, macroeconomic and broader market headwinds. Bitcoin is at a rare level below its 200-week moving average, ETF outflows are accelerating, and altcoins' independent rallies often last only a few days. If the broader market retests its lows, SUI is unlikely to escape unscathed.
VIII. Conclusion and Recommendations
SUI is currently in a position where the "extreme fear zone is worth watching, but it's not yet a buy with your eyes closed." A bottom is confirmed only when all three conditions are met: support holds, price reclaims resistance on rising volume, and on-chain capital flows and fundamentals improve in tandem. So far, only half of the first condition is met.
Different answers for three types of investors: For short-term traders who are underwater, the key is to treat 0.695764 as a discipline level, not treat your entry price as an article of faith. For market makers and quantitative traders, high turnover and 80% volatility favor range strategies over trend strategies. For institutions waiting to enter with risk controls, the signal to wait for is net spot inflows and a stabilizing TVL—not a 1.6% single-day price rebound.
Price is only the surface. Trading depth, stablecoin inflows, real users, and ecosystem revenue are what matter to the business. Until these indicators turn around, treat "buyers are stepping in" as a hypothesis, not a conclusion.#本周财报与宏观事件密集,市场再迎波动考验 #Anthropic上市倒计时,AI投资热度迎来检验 #加息预期仍强,FOMC纪要会否再添鹰派信号? #加州选民初步通过42号提案禁征加密资产新税 #加密美股齐跌,下轮反弹的驱动力在哪? $SUI


