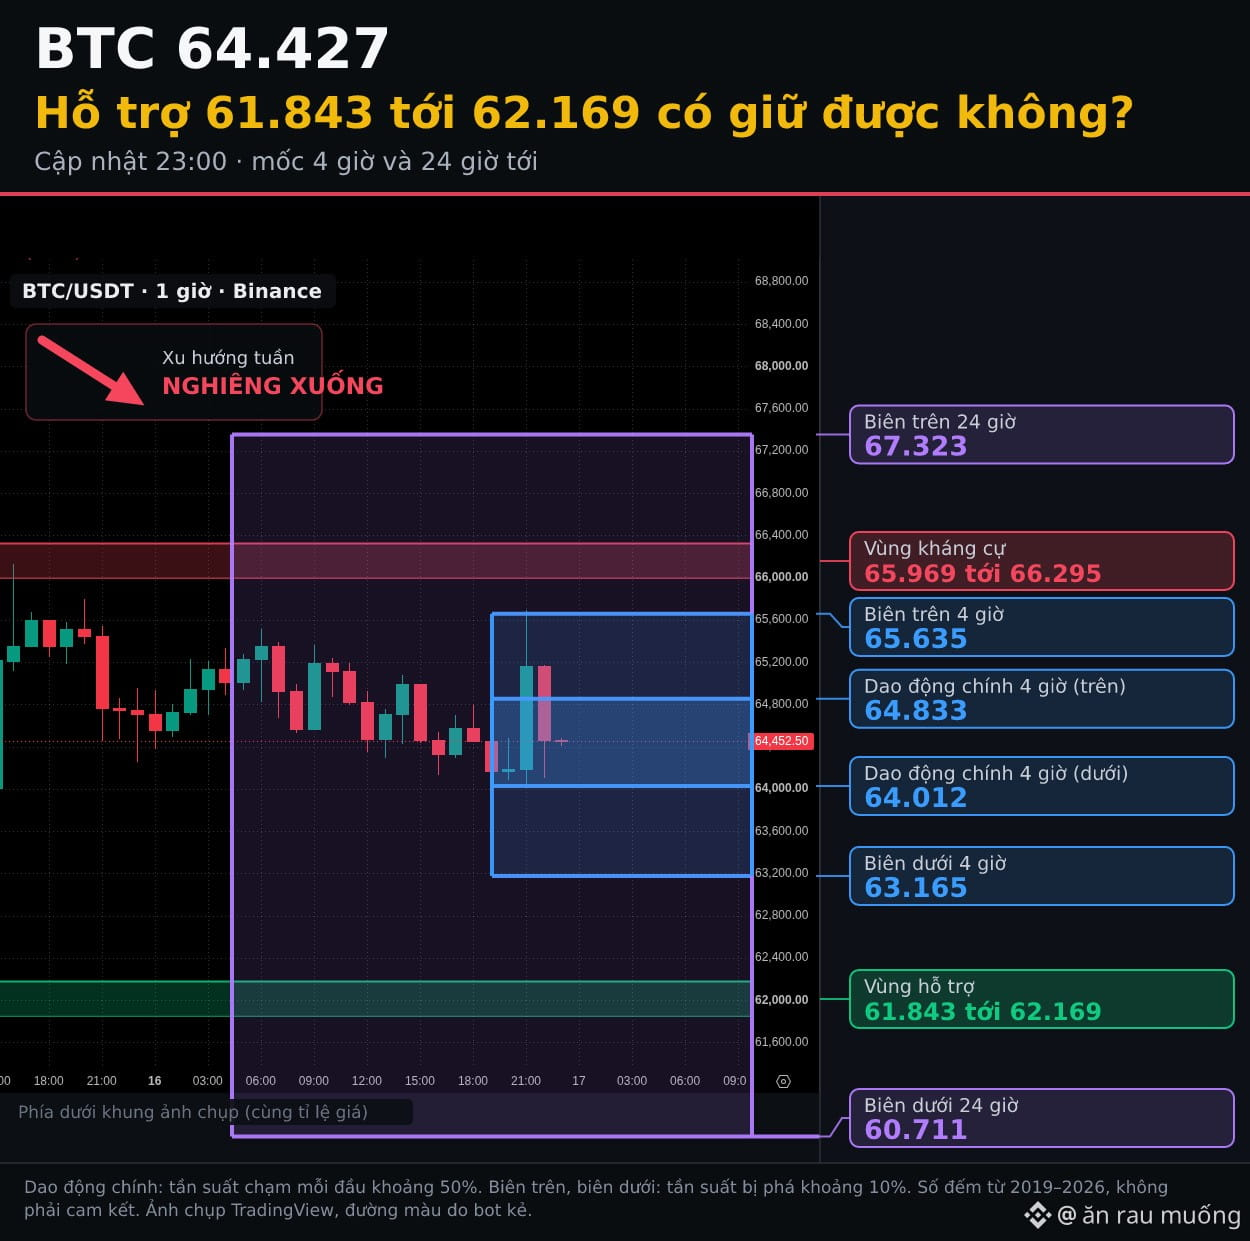
Hey everyone, trend update $BTC and $ETH 23:00: discount week, BTC 64.427. When will it reverse?
📉 Weekly trend: BEARISH, not broken yet (weaker signal than usual)
🧭 Trend-following trade: SHORT
Among 228 historical days similar to today, after 1 week:
• BTC down: 58%
• BTC up: 42%
• ETH down: 58%
🟠 BTC · 64.427 · +0,4% over the past 4 hours
📅 Daily trend: SIDEWAYS (−0,4% over the past 24 hours)
🧱 Support and resistance for the next 7 days:
• Support 61.843 to 62.169: 63% chance of being touched, 41% chance of a decisive break below
• Resistance 65.969 to 66.295: 64% chance of being touched, 33% chance of a decisive break above
🔄 Weekly trend reversal if: BTC breaks above 70.440
📍 Predicted trading range for the next 4 hours (until 03:00): 64.012 to 64.833
• Upper bound: 65.635
• Lower bound: 63.165
• 24-hour upper bound: 67.323
• 24-hour lower bound: 60.711
🔷 ETH · 1.818 · +1,0% over the past 4 hours
📅 Daily trend: SIDEWAYS (+0,2% over the past 24 hours)
🧱 Support and resistance for the next 7 days:
• Support 1.693 to 1.718: 63% chance of being touched, 41% chance of a decisive break below
• Resistance 1.893 to 1.907: 55% chance of being touched, 26% chance of a decisive break above
🔄 Weekly trend reversal if: ETH breaks above 2.055
📍 Predicted trading range for the next 4 hours (until 03:00): 1.802 to 1.834
• Upper bound: 1.865
• Lower bound: 1.768
• 24-hour upper bound: 1.929
• 24-hour lower bound: 1.685
🌐 Price-moving news:
• Negative news, high impact: The Fed is considering a 50-basis-point rate hike after October inflation data (16/11).
• Positive news, low impact: The IEA says oil supply is in surplus for the first time since the Iran war began, and oil prices have edged down (16/11).
Levels and percentages are based on BTC and ETH historical data from 2019 to 2026. Main trading range: each boundary is touched about 50% of the time. Upper and lower bounds: breached about 10% of the time. This is not investment advice. Manage your capital before placing a trade.
#BTC #ETH
📉 Weekly trend: BEARISH, not broken yet (weaker signal than usual)
🧭 Trend-following trade: SHORT
Among 228 historical days similar to today, after 1 week:
• BTC down: 58%
• BTC up: 42%
• ETH down: 58%
🟠 BTC · 64.427 · +0,4% over the past 4 hours
📅 Daily trend: SIDEWAYS (−0,4% over the past 24 hours)
🧱 Support and resistance for the next 7 days:
• Support 61.843 to 62.169: 63% chance of being touched, 41% chance of a decisive break below
• Resistance 65.969 to 66.295: 64% chance of being touched, 33% chance of a decisive break above
🔄 Weekly trend reversal if: BTC breaks above 70.440
📍 Predicted trading range for the next 4 hours (until 03:00): 64.012 to 64.833
• Upper bound: 65.635
• Lower bound: 63.165
• 24-hour upper bound: 67.323
• 24-hour lower bound: 60.711
🔷 ETH · 1.818 · +1,0% over the past 4 hours
📅 Daily trend: SIDEWAYS (+0,2% over the past 24 hours)
🧱 Support and resistance for the next 7 days:
• Support 1.693 to 1.718: 63% chance of being touched, 41% chance of a decisive break below
• Resistance 1.893 to 1.907: 55% chance of being touched, 26% chance of a decisive break above
🔄 Weekly trend reversal if: ETH breaks above 2.055
📍 Predicted trading range for the next 4 hours (until 03:00): 1.802 to 1.834
• Upper bound: 1.865
• Lower bound: 1.768
• 24-hour upper bound: 1.929
• 24-hour lower bound: 1.685
🌐 Price-moving news:
• Negative news, high impact: The Fed is considering a 50-basis-point rate hike after October inflation data (16/11).
• Positive news, low impact: The IEA says oil supply is in surplus for the first time since the Iran war began, and oil prices have edged down (16/11).
Levels and percentages are based on BTC and ETH historical data from 2019 to 2026. Main trading range: each boundary is touched about 50% of the time. Upper and lower bounds: breached about 10% of the time. This is not investment advice. Manage your capital before placing a trade.
#BTC #ETH