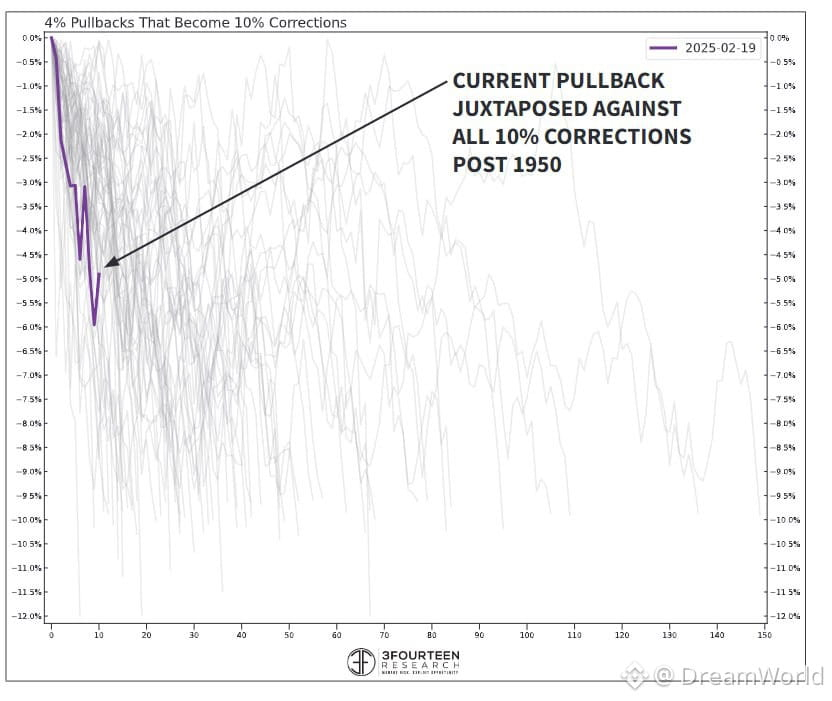

📊 What it takes for the S&P 500 decline not to turn into a major correction
A comparison by 3Fourteen Research
Gray shows every instance since 1950 when a 4% pullback in the S&P 500 became a correction, meaning a decline of 10% or more.
Three-quarters of them happened within 60 days of the peak, and half within 40 days. In other words, the longer the index stays above -10%, the lower the odds of a correction.
Since its October 6 peak, the S&P 500 has fallen 6%, with its biggest drop on November 5. A total of 35 days have passed, so the “window” will close in early December.
Again, the index is holding up, but 62% of its stocks are already 10% or more below their yearly highs (CNBC data).
The -10% level from the October record is around 7,040 points. If the index doesn’t reach it by early December, statistically, the pullback will most likely remain just a pullback.
A comparison by 3Fourteen Research
Gray shows every instance since 1950 when a 4% pullback in the S&P 500 became a correction, meaning a decline of 10% or more.
Three-quarters of them happened within 60 days of the peak, and half within 40 days. In other words, the longer the index stays above -10%, the lower the odds of a correction.
Since its October 6 peak, the S&P 500 has fallen 6%, with its biggest drop on November 5. A total of 35 days have passed, so the “window” will close in early December.
Again, the index is holding up, but 62% of its stocks are already 10% or more below their yearly highs (CNBC data).
The -10% level from the October record is around 7,040 points. If the index doesn’t reach it by early December, statistically, the pullback will most likely remain just a pullback.