BTC: From Halving to Bull-Market Peak Cycle
The 534-day model window anchored to the halving has passed, but this does not mean an actual top has been confirmed on-chain.
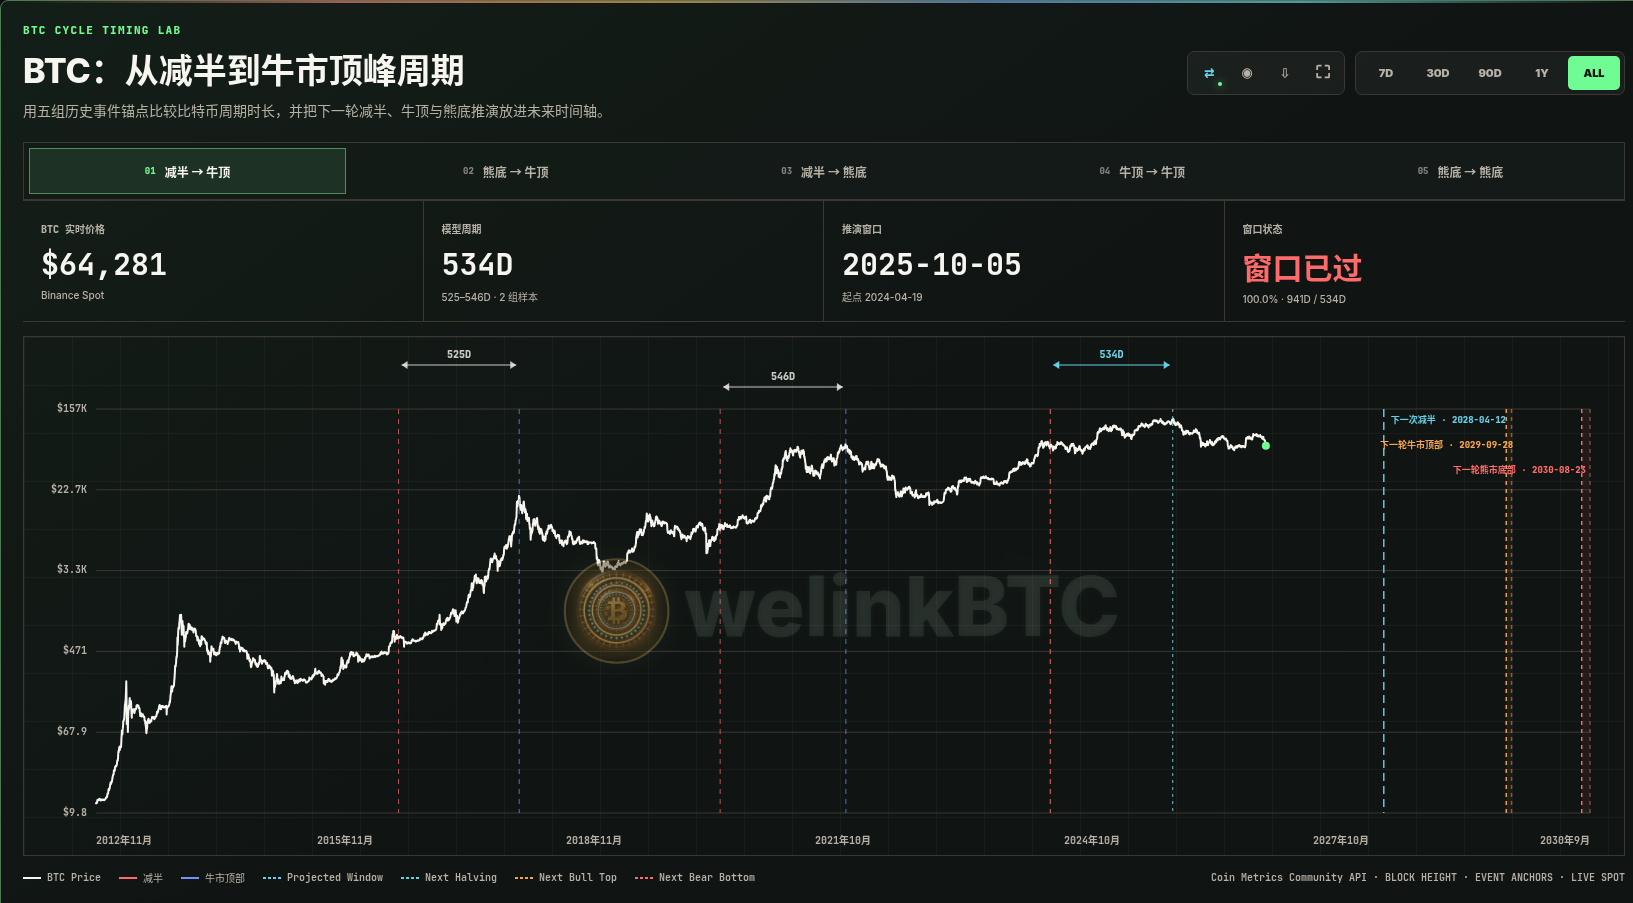
As of 2026-11-15, 941 days have passed since the 2024-04-19 halving—407 days beyond the 534-day model window. By the model’s measure, the window is 100% complete. BTC’s current price is approximately $64,281. The model uses a 534-day cycle, based on the midpoint of two completed samples spanning 525–546 days, which puts the projected window’s endpoint at 2025-10-05.
How should you read this indicator? It uses the historical duration from halving to bull-market peak to create a research projection for the current cycle. The two completed samples are: 2016-07-09 to 2017-12-17, lasting 525 days, with the price rising from approximately $652 to $19,250; and 2020-05-11 to 2021-11-10, lasting 546 days, with the price rising from approximately $8,592 to $64,756. The two samples closely align, so 534 days is used as the projection window for the current cycle.
Extrapolating from the same set of anchors, the protocol-estimated date for the next halving is 2028-04-12 (73,897 blocks remain until block height 1,050,000); the model observation date for the next bull-market peak is 2029-09-28, with a validation window through 2029-10-21; and the model observation date for the next bear-market bottom is 2030-08-23, with a validation window through 2030-09-28.
The window having passed only means that the current point in time has moved beyond the historical midpoint represented by these samples; it does not mean a top or bottom has already occurred. ETFs, fiat liquidity, market size, and macroeconomic policy could all cause the cycle to arrive earlier or later—or even render the model invalid. It is better suited as a time frame than as a point prediction.
More selected on-chain cycle indicators
Portal: https://welinkbtc-onchainmain.xyz/
Understand cycles like a professional analyst
$BTC
The 534-day model window anchored to the halving has passed, but this does not mean an actual top has been confirmed on-chain.
As of 2026-11-15, 941 days have passed since the 2024-04-19 halving—407 days beyond the 534-day model window. By the model’s measure, the window is 100% complete. BTC’s current price is approximately $64,281. The model uses a 534-day cycle, based on the midpoint of two completed samples spanning 525–546 days, which puts the projected window’s endpoint at 2025-10-05.
How should you read this indicator? It uses the historical duration from halving to bull-market peak to create a research projection for the current cycle. The two completed samples are: 2016-07-09 to 2017-12-17, lasting 525 days, with the price rising from approximately $652 to $19,250; and 2020-05-11 to 2021-11-10, lasting 546 days, with the price rising from approximately $8,592 to $64,756. The two samples closely align, so 534 days is used as the projection window for the current cycle.
Extrapolating from the same set of anchors, the protocol-estimated date for the next halving is 2028-04-12 (73,897 blocks remain until block height 1,050,000); the model observation date for the next bull-market peak is 2029-09-28, with a validation window through 2029-10-21; and the model observation date for the next bear-market bottom is 2030-08-23, with a validation window through 2030-09-28.
The window having passed only means that the current point in time has moved beyond the historical midpoint represented by these samples; it does not mean a top or bottom has already occurred. ETFs, fiat liquidity, market size, and macroeconomic policy could all cause the cycle to arrive earlier or later—or even render the model invalid. It is better suited as a time frame than as a point prediction.
More selected on-chain cycle indicators
Portal: https://welinkbtc-onchainmain.xyz/
Understand cycles like a professional analyst
$BTC