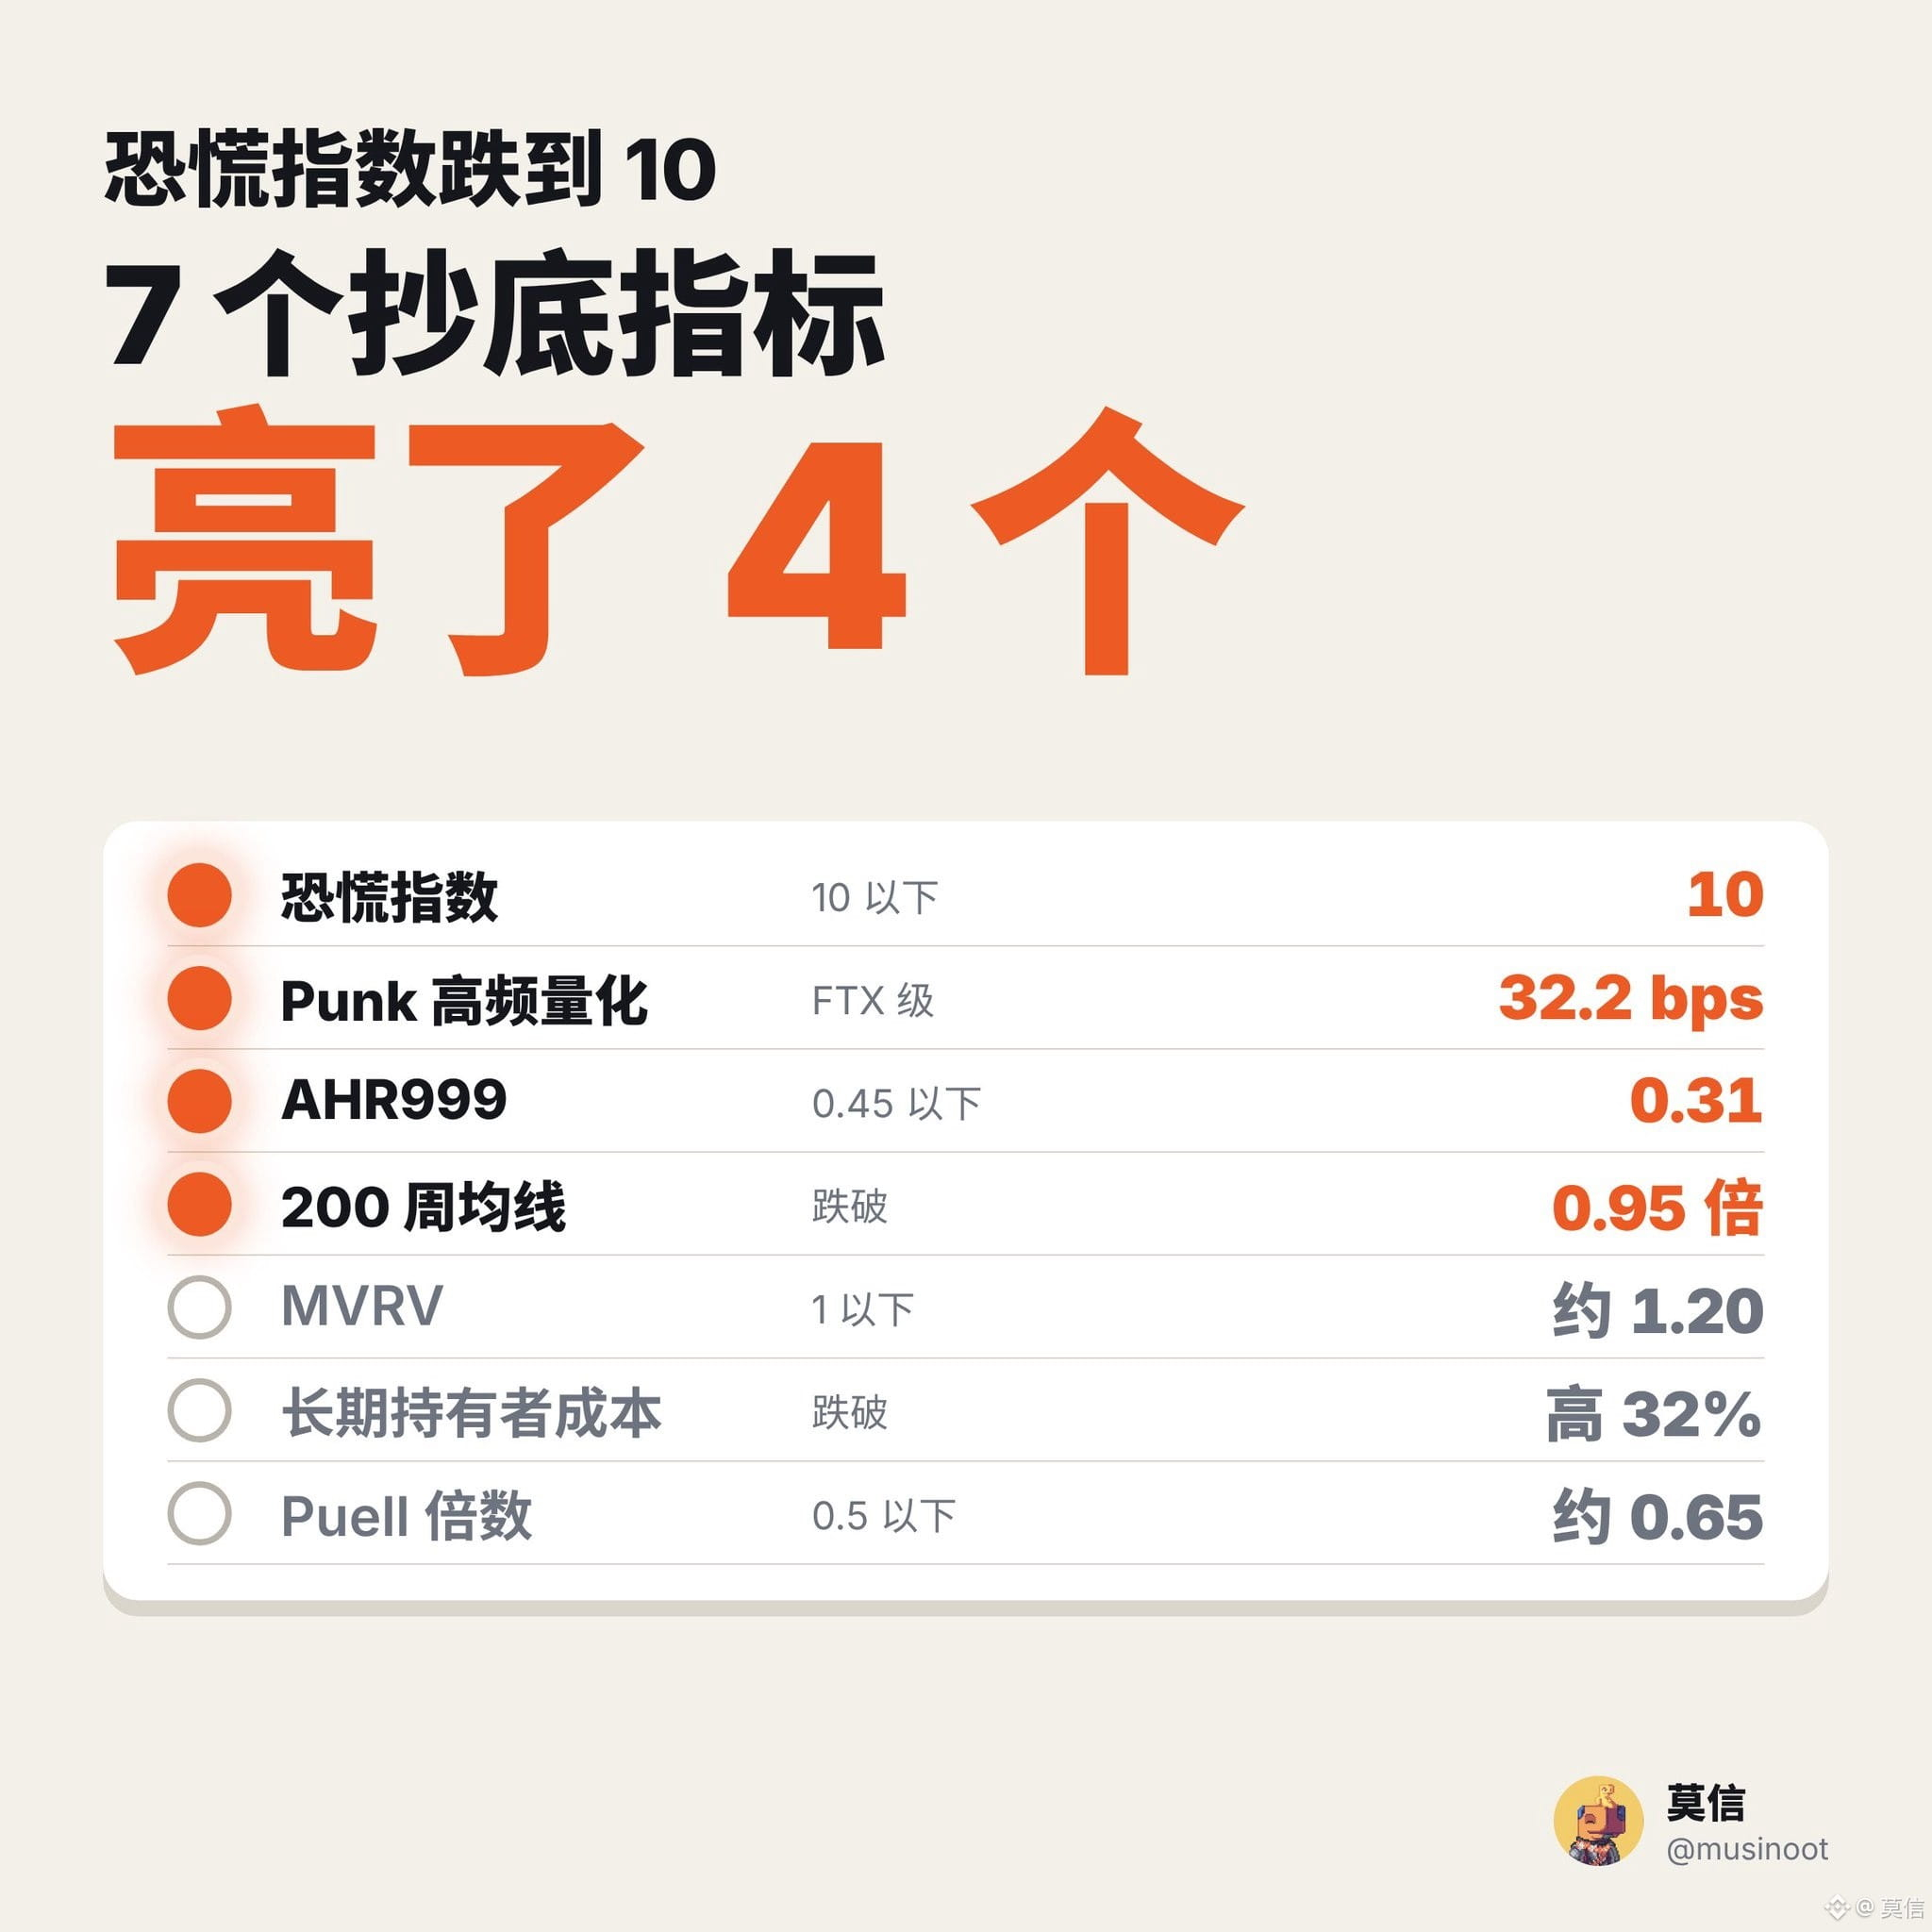
Moxin Observations | Fear & Greed Index falls to 10; 4 of 7 buy-the-dip indicators are flashing
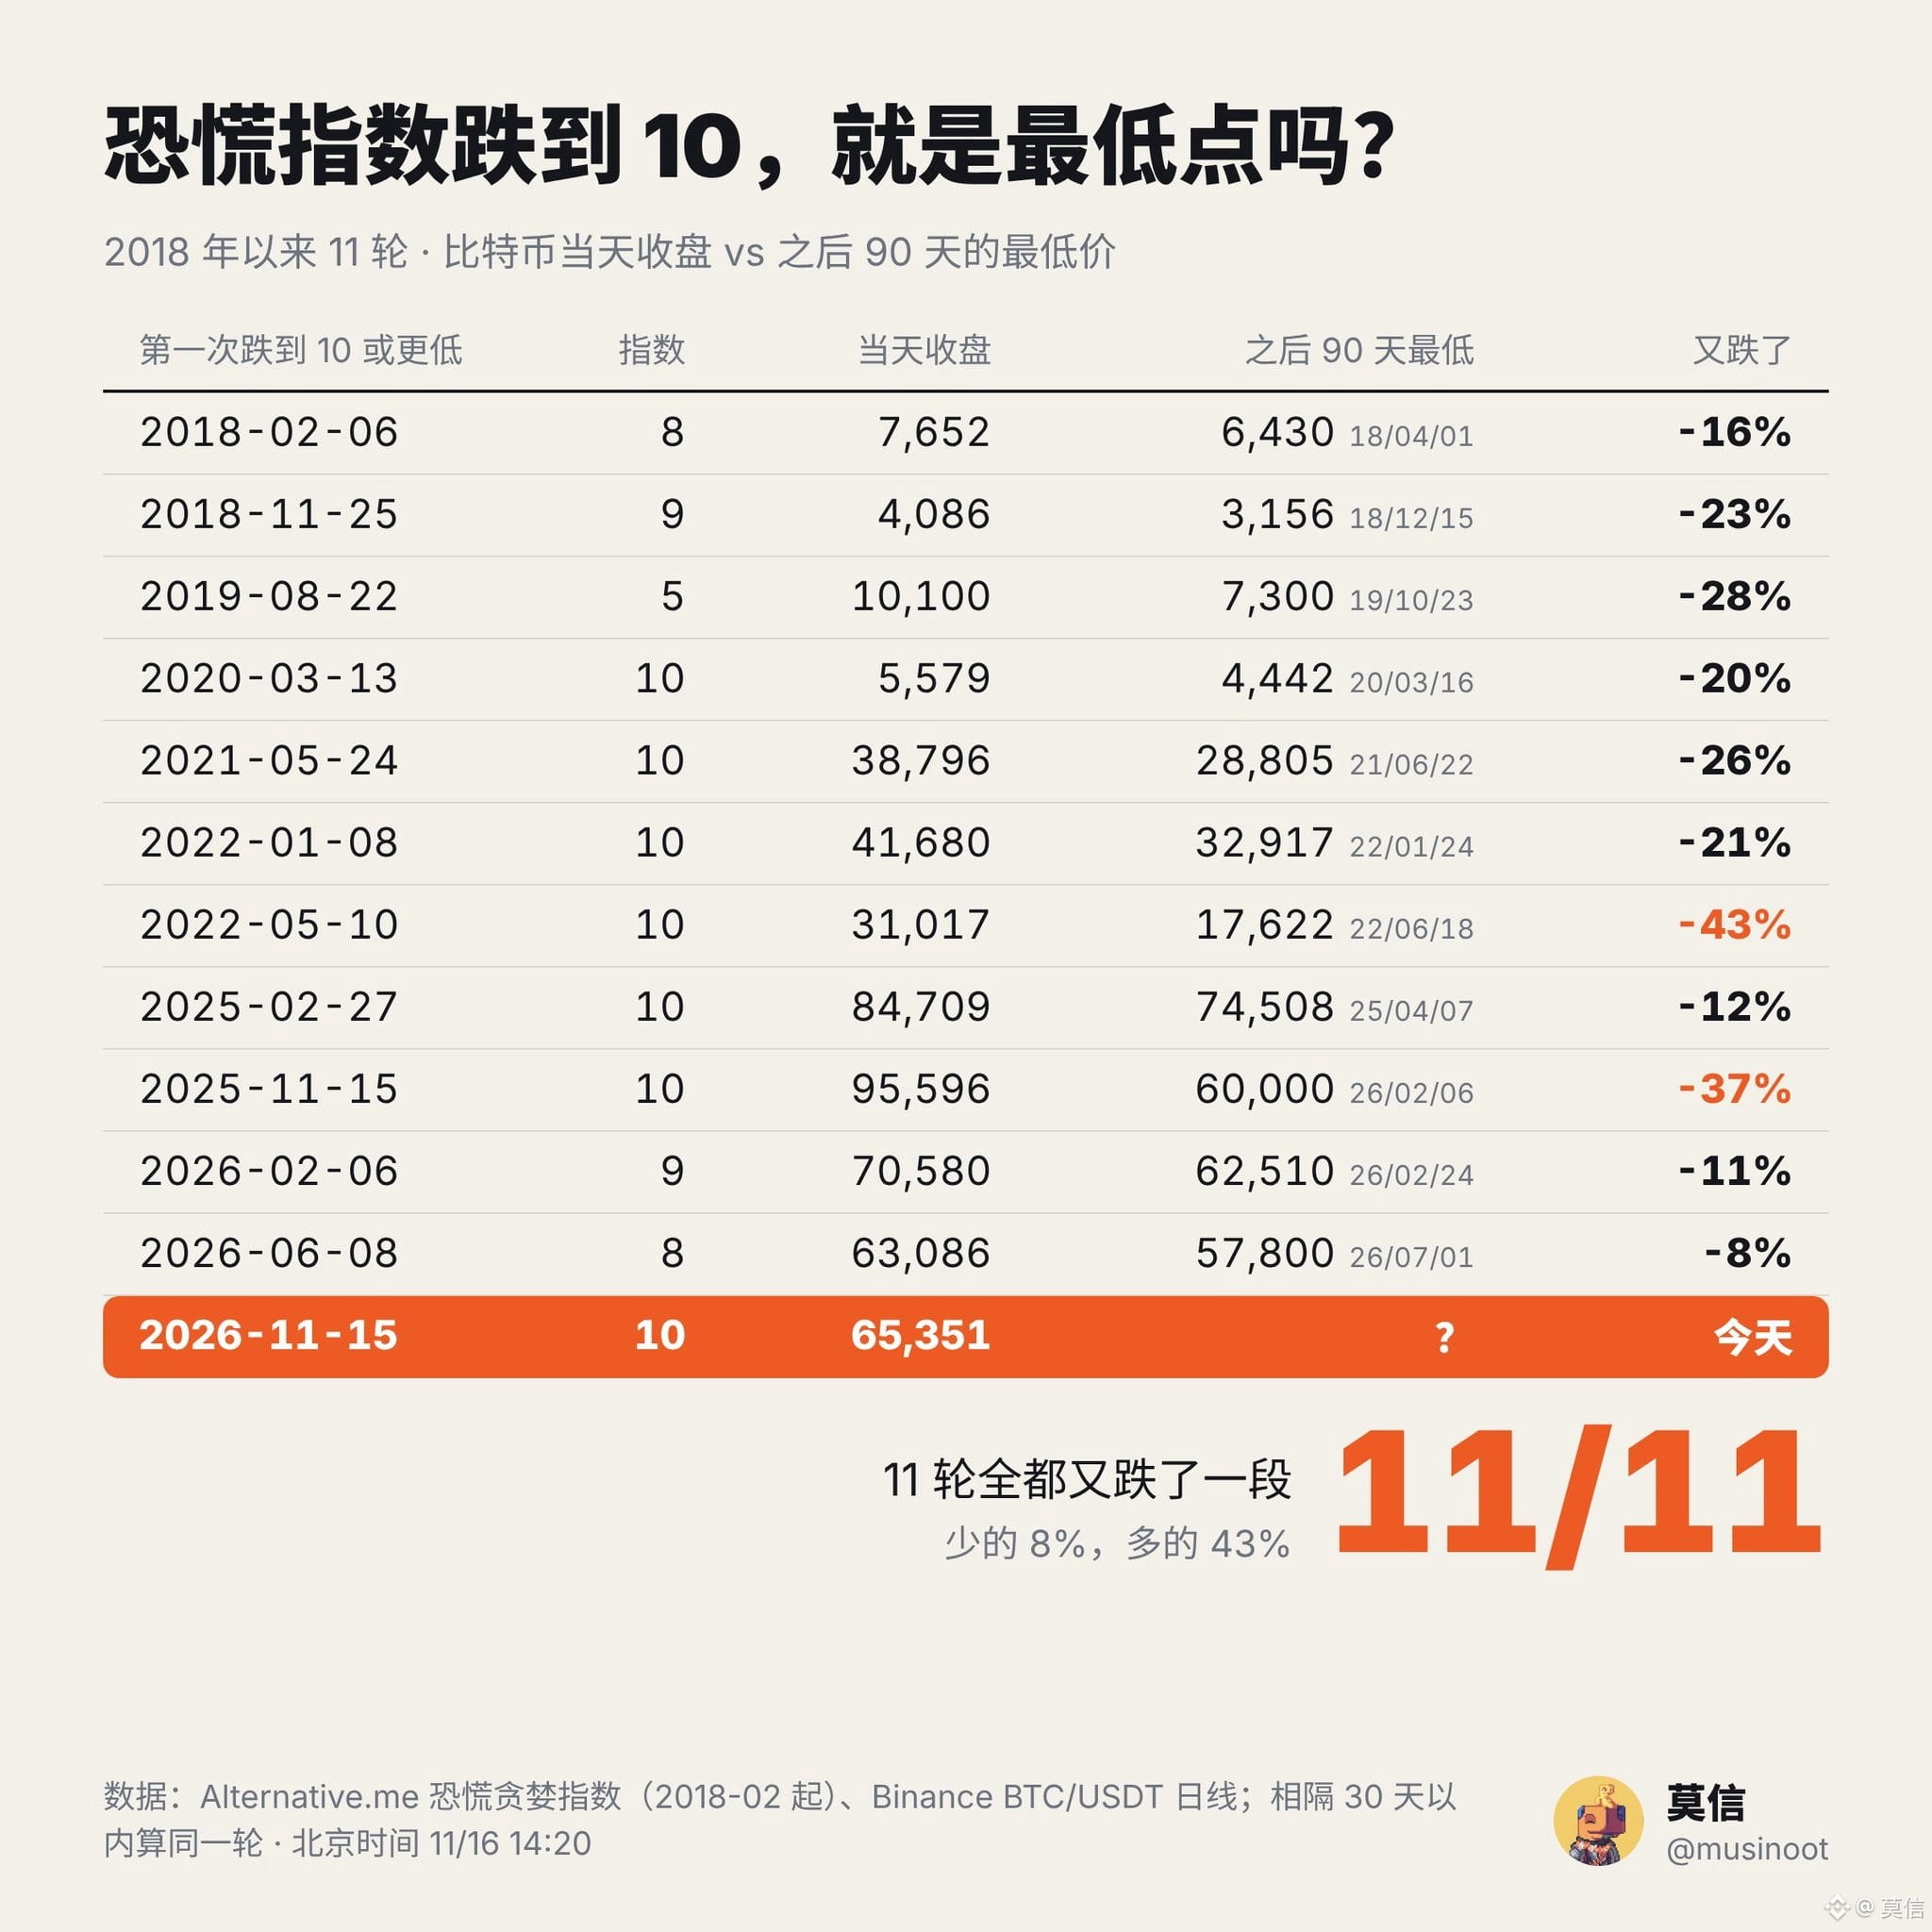
The Fear & Greed Index is at 10 today. Since 2018, it has fallen to 10 or below 11 times. In the 90 days after each time, Bitcoin kept falling, by anywhere from 8% to 43%.
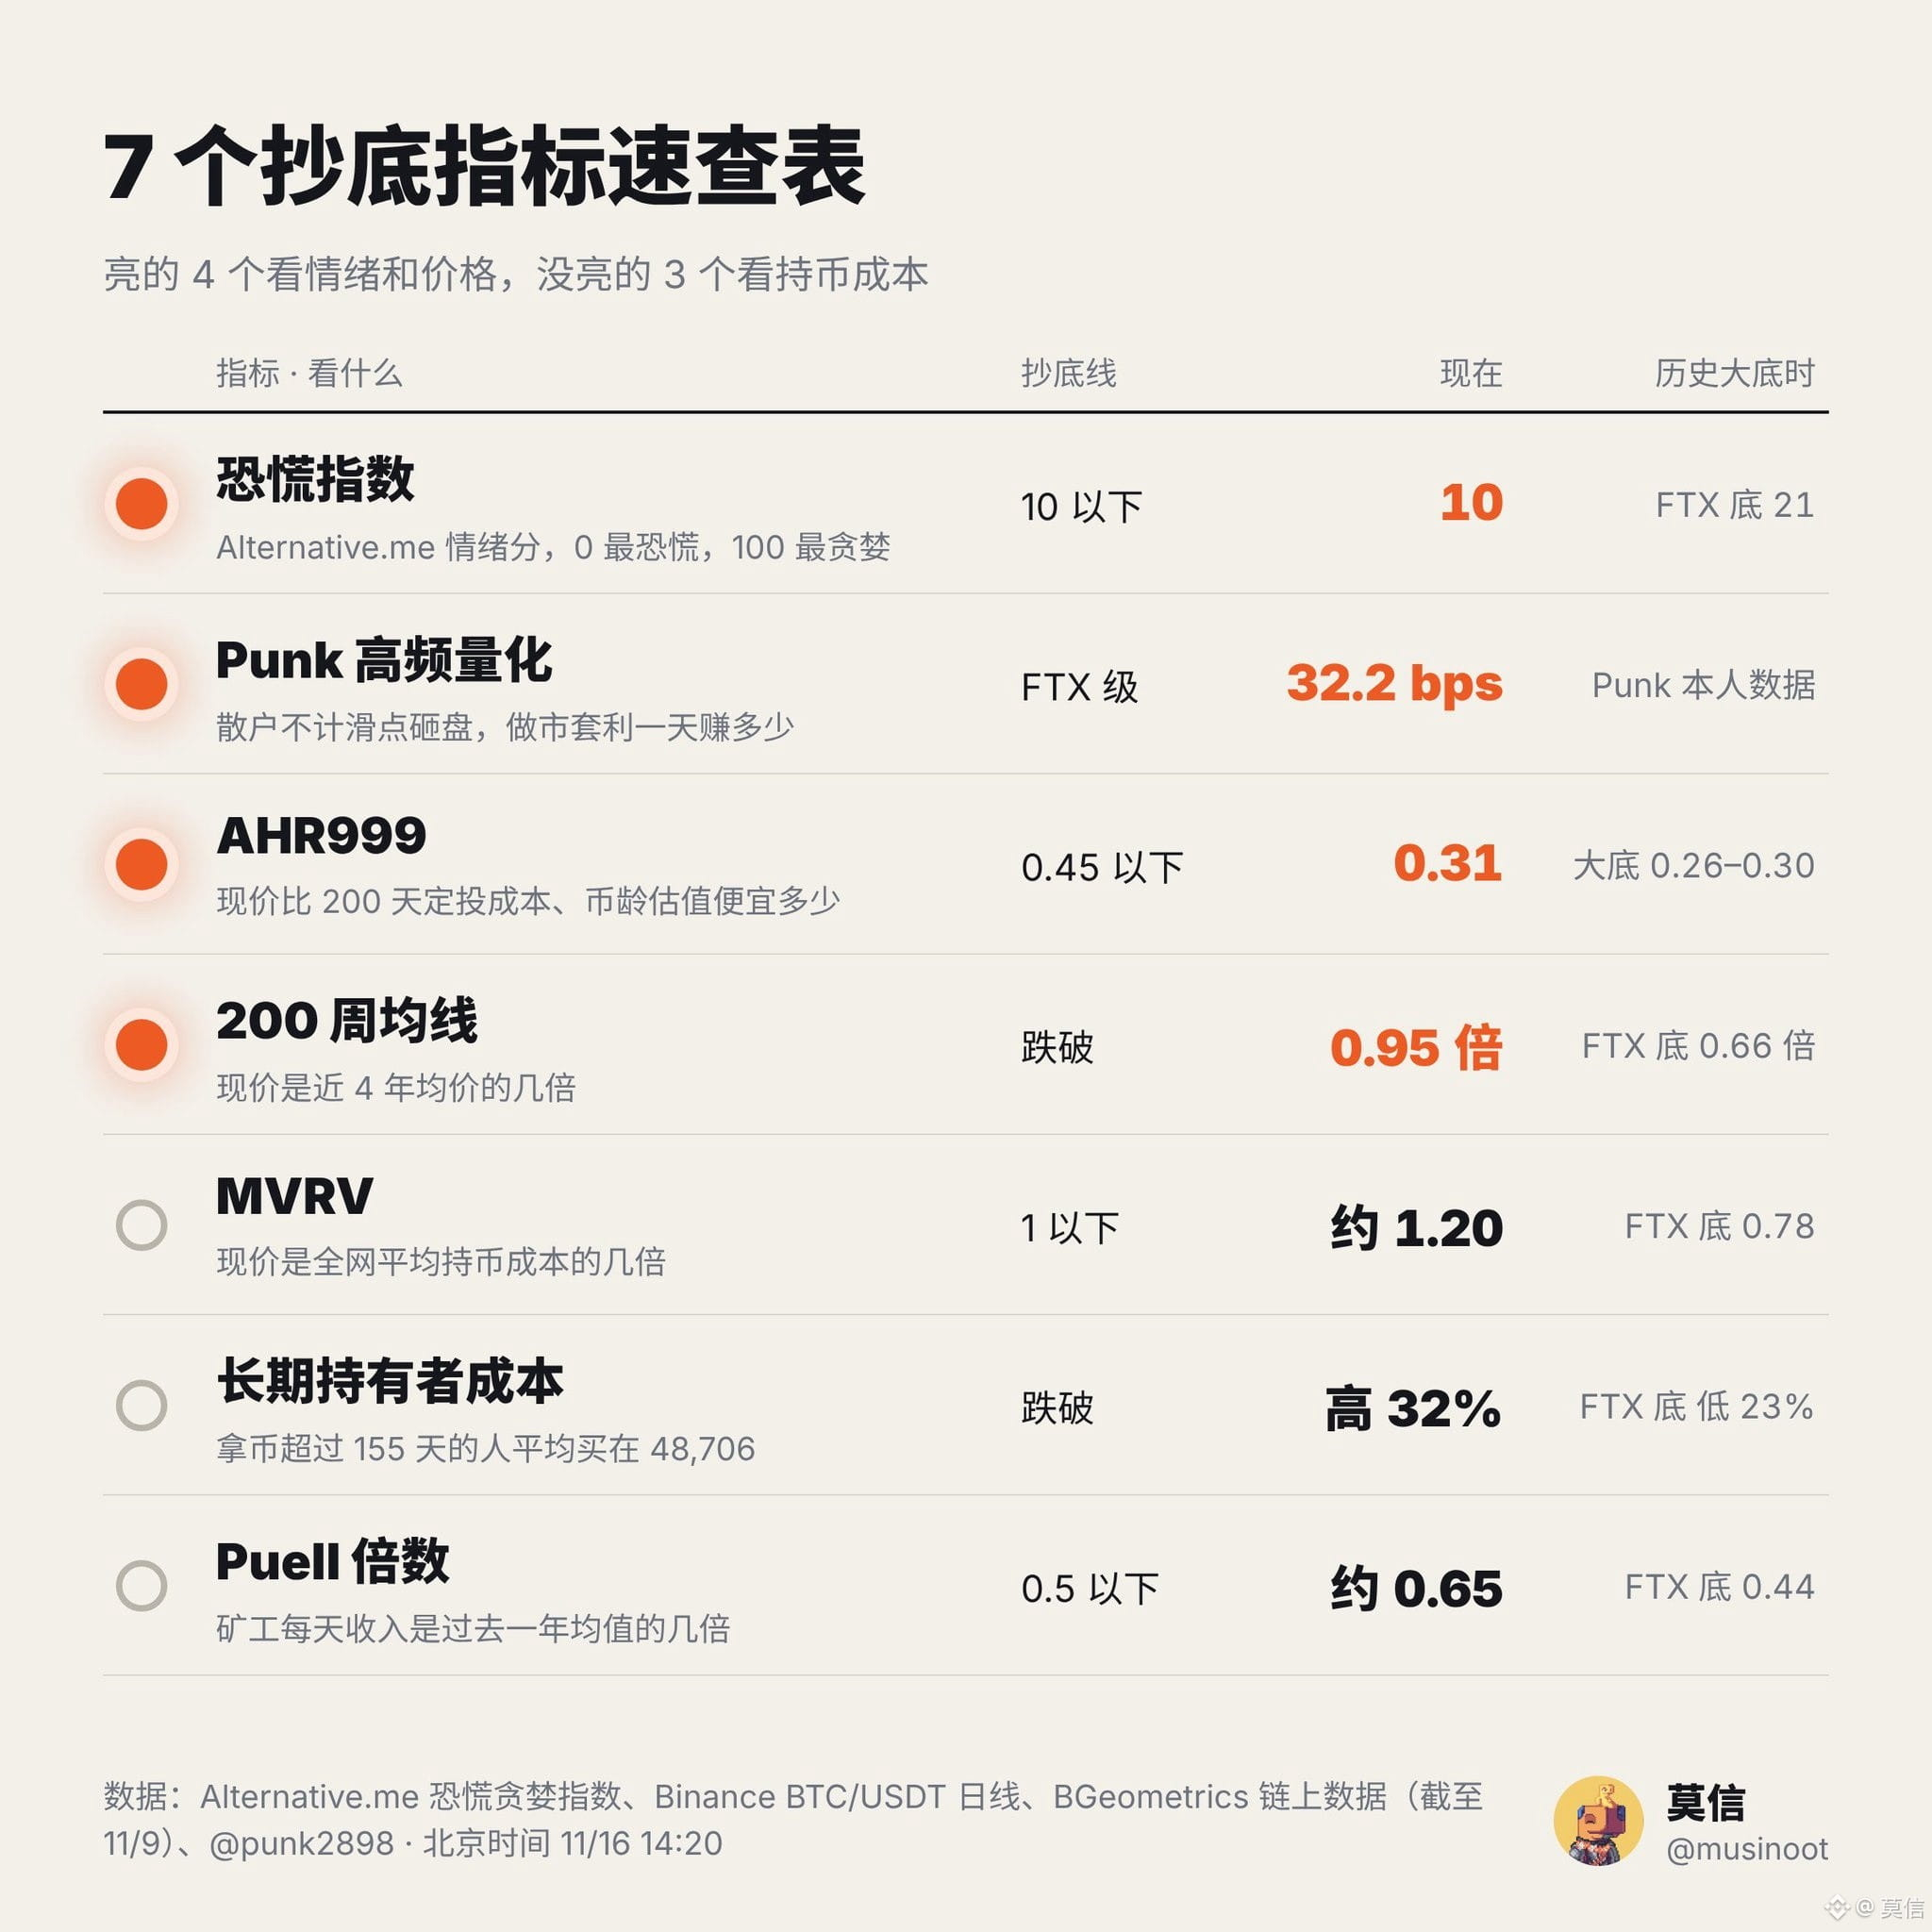
Over the past two days, quite a few people have pointed to the Fear & Greed Index as a sign that the bottom is in. @punk2898 also shared data from his high-frequency quantitative strategy. I’ve put together the 7 indicators most discussed on X over the past few days and compared them with their readings at historical market bottoms: 4 are flashing, and 3 aren’t.
🐋 Fear & Greed Index: bottoms happen amid fear, but prices can fall further afterward
- Alternative.me gives market sentiment a score each day: 0 means extreme fear, and 100 means extreme greed
- Readings on several major bottom dates: 11 on 2018/12/15, 10 on 2020/3/13, 6 on 2022/6/18, and 11 on 7/1 this year; during the FTX collapse (2022/11/21), it only reached 21
- The day it falls to 10 or below is often not the low: on 2022/5/10, the first day it fell to 10, Bitcoin closed at 31,017 and fell to 17,622 39 days later; on 11/15 last year, it closed at 95,596 and fell to 60,000 83 days later
Across those 11 episodes, the low came between 3 and 83 days after the first drop to 10. A single-digit Fear & Greed Index means the market is already hurting badly, but the low usually still lies ahead.
🐋 Punk’s high-frequency quantitative strategy: 32.2 bps
- His strategy captures contract price spreads between centralized exchanges and on-chain markets, while providing liquidity to the order book. The more retail traders sell without regard for slippage, the more he earns
- Today’s figure is 32.2 bps, or 0.322% per day. He says this is the kind of reading only seen during an FTX-style collapse
- Only he can see this indicator, so it’s a measure of fear from a market-making perspective
🐋 Price indicators: AHR999 and the 200-week moving average are flashing
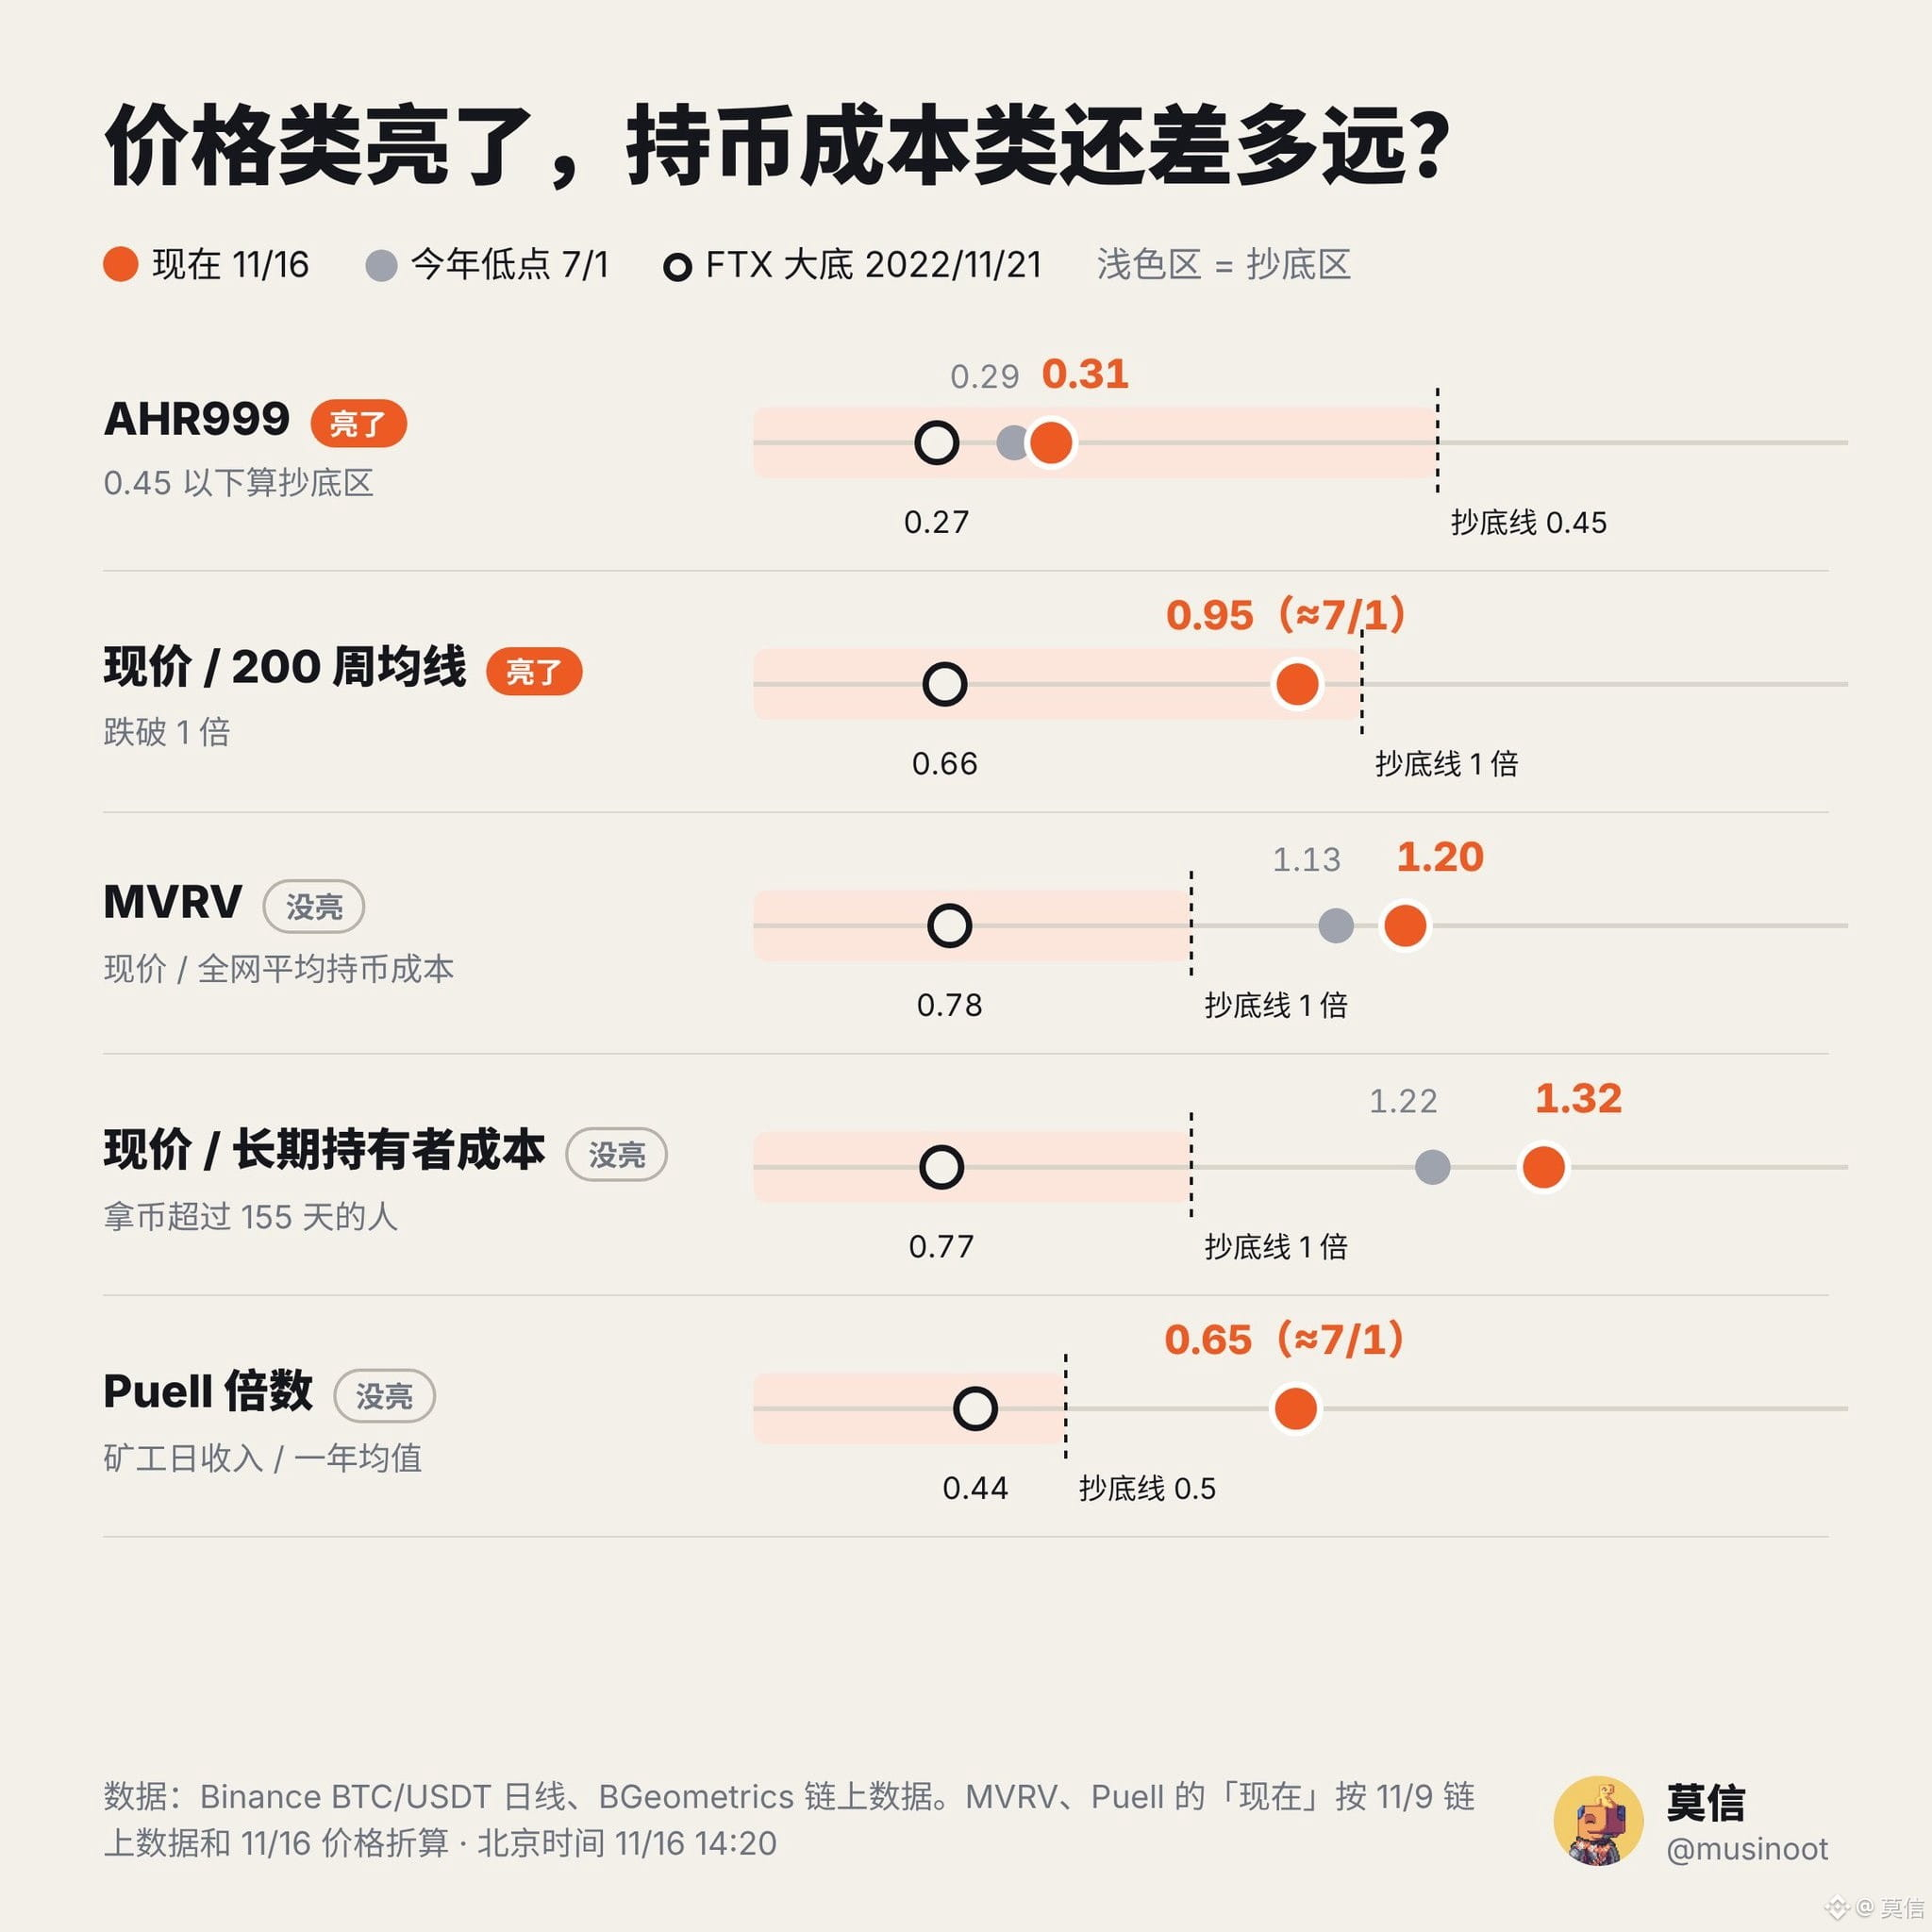
- AHR999 compares the current price with the dollar-cost averaging cost over the past 200 days and a valuation ratio calculated based on coin age. Below 0.45 is considered a buy-the-dip zone. It’s around 0.31 now; historical major bottoms ranged from 0.26 to 0.30, and it was 0.29 on 7/1 this year
- The 200-week moving average is the average price over nearly 4 years. It’s now 67,976, and the current price is 0.95 times that level. During the FTX collapse, it fell to 0.66 times that level
🐋 Cost-basis indicators: MVRV, long-term holder cost basis, and Puell are not flashing yet
- MVRV is the current price divided by the network-wide average coin cost (the price at which each coin last changed hands on-chain). The average cost is about 53,876, and the current price is about 1.2 times that level; during the FTX collapse, it was 0.78
- Long-term holders (addresses that have held coins for over 155 days) bought at an average price of 48,706, which is 32% below the current price. During the FTX collapse, the current price was 23% below their cost basis
- The Puell Multiple is miners’ daily revenue divided by the average over the past year. It was 0.76 on 11/9, or about 0.65 when adjusted to today’s price; during the FTX collapse, it was 0.44
- At this year’s 7/1 low of 57,800, none of these three had reached their thresholds either: MVRV was 1.13, Puell was 0.65, and the current price was 22% above long-term holders’ cost basis
The 4 that are flashing measure sentiment and how far prices are from average; the 3 that aren’t look at how much holders paid for their coins.
——
This article was first published on X: @musinoot
The Fear & Greed Index is at 10 today. Since 2018, it has fallen to 10 or below 11 times. In the 90 days after each time, Bitcoin kept falling, by anywhere from 8% to 43%.
Over the past two days, quite a few people have pointed to the Fear & Greed Index as a sign that the bottom is in. @punk2898 also shared data from his high-frequency quantitative strategy. I’ve put together the 7 indicators most discussed on X over the past few days and compared them with their readings at historical market bottoms: 4 are flashing, and 3 aren’t.
🐋 Fear & Greed Index: bottoms happen amid fear, but prices can fall further afterward
- Alternative.me gives market sentiment a score each day: 0 means extreme fear, and 100 means extreme greed
- Readings on several major bottom dates: 11 on 2018/12/15, 10 on 2020/3/13, 6 on 2022/6/18, and 11 on 7/1 this year; during the FTX collapse (2022/11/21), it only reached 21
- The day it falls to 10 or below is often not the low: on 2022/5/10, the first day it fell to 10, Bitcoin closed at 31,017 and fell to 17,622 39 days later; on 11/15 last year, it closed at 95,596 and fell to 60,000 83 days later
Across those 11 episodes, the low came between 3 and 83 days after the first drop to 10. A single-digit Fear & Greed Index means the market is already hurting badly, but the low usually still lies ahead.
🐋 Punk’s high-frequency quantitative strategy: 32.2 bps
- His strategy captures contract price spreads between centralized exchanges and on-chain markets, while providing liquidity to the order book. The more retail traders sell without regard for slippage, the more he earns
- Today’s figure is 32.2 bps, or 0.322% per day. He says this is the kind of reading only seen during an FTX-style collapse
- Only he can see this indicator, so it’s a measure of fear from a market-making perspective
🐋 Price indicators: AHR999 and the 200-week moving average are flashing
- AHR999 compares the current price with the dollar-cost averaging cost over the past 200 days and a valuation ratio calculated based on coin age. Below 0.45 is considered a buy-the-dip zone. It’s around 0.31 now; historical major bottoms ranged from 0.26 to 0.30, and it was 0.29 on 7/1 this year
- The 200-week moving average is the average price over nearly 4 years. It’s now 67,976, and the current price is 0.95 times that level. During the FTX collapse, it fell to 0.66 times that level
🐋 Cost-basis indicators: MVRV, long-term holder cost basis, and Puell are not flashing yet
- MVRV is the current price divided by the network-wide average coin cost (the price at which each coin last changed hands on-chain). The average cost is about 53,876, and the current price is about 1.2 times that level; during the FTX collapse, it was 0.78
- Long-term holders (addresses that have held coins for over 155 days) bought at an average price of 48,706, which is 32% below the current price. During the FTX collapse, the current price was 23% below their cost basis
- The Puell Multiple is miners’ daily revenue divided by the average over the past year. It was 0.76 on 11/9, or about 0.65 when adjusted to today’s price; during the FTX collapse, it was 0.44
- At this year’s 7/1 low of 57,800, none of these three had reached their thresholds either: MVRV was 1.13, Puell was 0.65, and the current price was 22% above long-term holders’ cost basis
The 4 that are flashing measure sentiment and how far prices are from average; the 3 that aren’t look at how much holders paid for their coins.
——
This article was first published on X: @musinoot