


I. Review of market movements over the past month and a half: accurate calls on the big picture and reflections on timing
At 11:40 a.m. on November 16, Beijing time, let’s take a comprehensive look at the latest market movements across global assets and review what has happened. Over the past month and a half, markets have been turbulent. Our overall read on the big picture was highly accurate, though we also had to weather some challenges and reflect on our calls regarding short-term timing.
As early as September 26, we were quick to spot a daily-chart bearish divergence in Bitcoin and projected that its price would return to $70,000—a pullback that would “pick up passengers.” We then clearly stated that the five-wave advance had ended and the three-wave ABC decline had begun. The decline in wave A has now played out, but the market has yet to mount a meaningful wave B rebound. On September 29, we issued a further warning that support at $82,800 was likely to give way and that investors should prepare for a sharp sell-off. Although U.S. Treasury yields remained persistently high at the time, both AI stocks and Bitcoin continued to struggle to hold up. It was not until October 8, when we spotted a false breakout and bearish topping signals in semiconductor giant Micron (MU), that we concluded the upstream AI infrastructure sector was already showing signs of fatigue—and Bitcoin would inevitably be affected. On October 9, we decisively said, “If the rebound fails to break above $84,500, look for a drop to $70,000,” and bluntly pointed out that the KOLs blindly predicting a huge rally were seriously misleading the market.
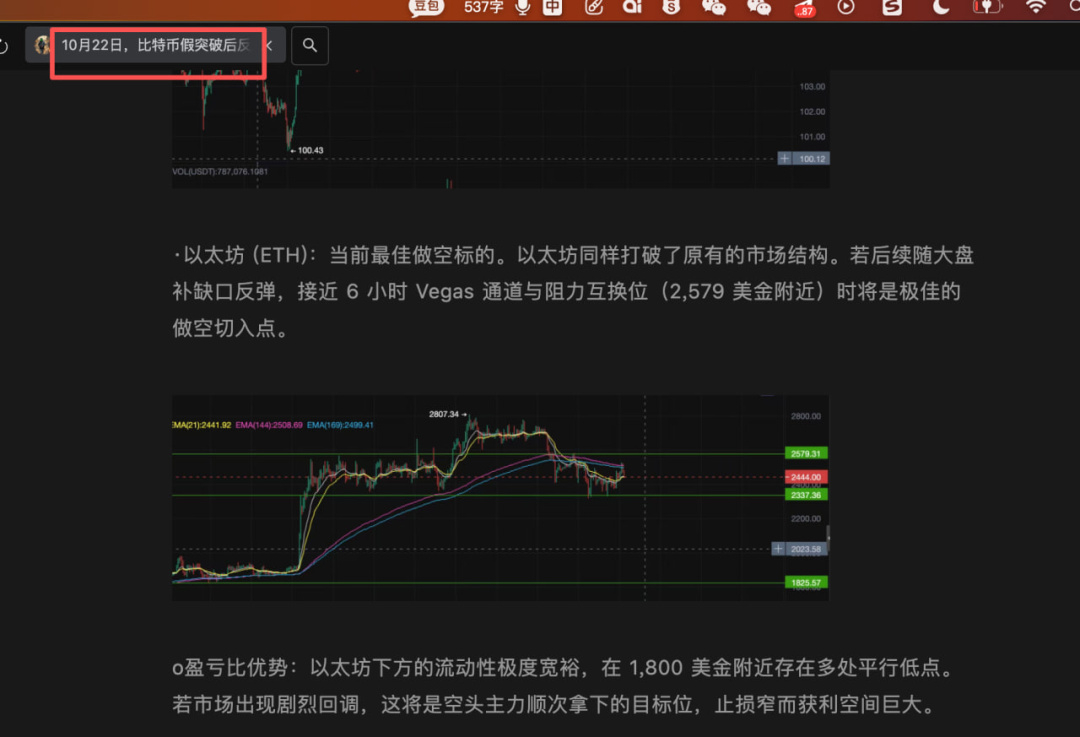
However, the path downward was not without its twists and turns. With bullish sentiment still strong at the time, major players seized the opportunity to push prices up and liquidate shorts, allowing them to distribute their holdings at higher levels. On October 15, Bitcoin officially broke below $82,800, kicking off a battle to defend $80,000. At the same time, altcoins such as Ethereum broke below their neckline levels. On October 16, we accurately predicted that Bitcoin would continue lower after taking liquidity above $84,500, and noted that the Nasdaq Index had another month of declines ahead. As of today, exactly one month has passed, and the Nasdaq’s downtrend is still not fully over. Then, on October 22, Bitcoin duly swept the liquidity above and plunged rapidly. The decline was so swift that it dropped straight to $81,000 without filling the gap at $82,000, catching some heavily invested spot holders and short sellers off guard. On October 26, we laid out a high risk-reward plan to short Ethereum at $2,580 on the 6-hour Vegas channel, with a stop loss at $2,807 and a target of liquidity at $1,800. Unfortunately, after touching resistance at the channel, the price moved lower ahead of schedule.
As November began, the market staged a brief rebound amid the so-called “black swan” event and the midterm elections. On November 4, we clearly stated that although there was liquidity above and ironclad support below, the overall outlook remained bearish. However, in the trading that followed, perhaps because things had been going smoothly before, my forecasts began to show some subjective bullish bias. When the price touched the 200-day moving average last Tuesday, I expected the market to test support twice and form a “spring” reversal to kick off a B-wave rally. Then, last Thursday, when MicroStrategy was removed from the index and Bitcoin did not crash, I mistakenly thought the market was building toward a rebound after the panic. It was not until last Friday’s plunge that the market gave us the most objective correction.
This experience was a powerful confirmation of the trading philosophy that “there is no need to predict the long term, and the short term cannot be predicted.” When the broader picture shows “signs of demise,” such as bearish divergences at a major top, a complete trend reversal often requires patience. In the meantime, major players will inevitably engineer relief rallies to lure the last bulls into becoming overconfident.
Fortunately, we only made one unsuccessful attempt to go long. When trying a short-term long, we set an extremely tight stop loss ($73,000) and exited quickly after the second test of the 200-day moving average failed, successfully avoiding the subsequent catastrophic plunge. The only regret is that we bought some of the dip ahead of schedule, based on our original target, leaving some partners heavily positioned with limited dry powder. This is a reminder that we must discard subjective biases and develop strategies in response to even the smallest changes in price action.
II. Macroeconomic Environment and Bitcoin Technical Outlook: A Life-and-Death Battle Between Bulls and Bears
From a macro perspective, although spot Bitcoin ETFs saw net outflows last week, the total net outflow for the week was less than 10,000 BTC. Based on ETF data alone, the market should not have fallen so severely. The real driver was the 10-year U.S. Treasury yield surging to 5.1% last Friday. For the market to return to a healthy bullish structure, Treasury yields must fall below the key support formed by the rising trendline and the 200-day moving average at 4.6%.
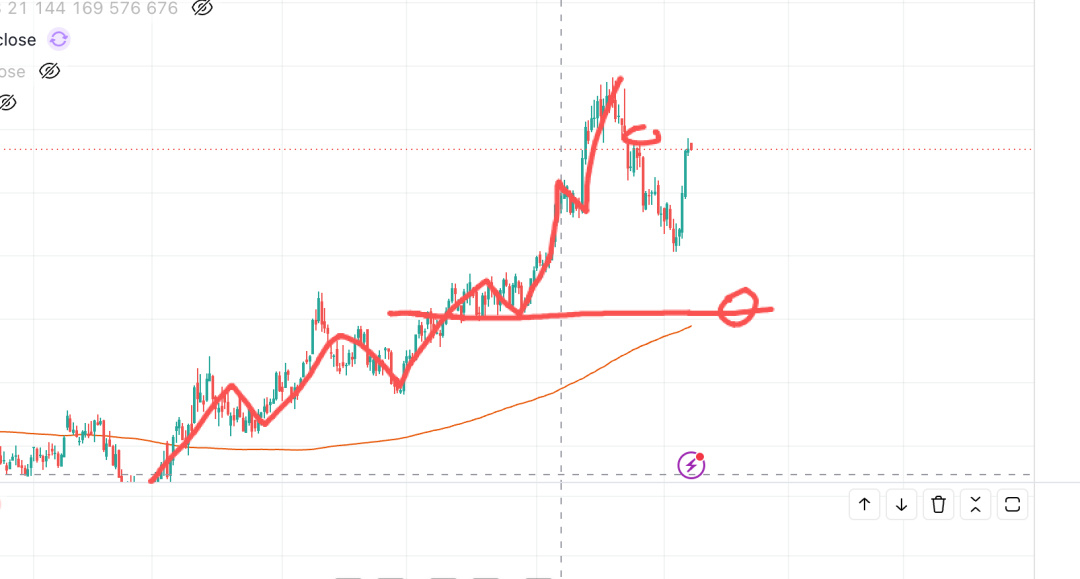
It remains to be seen whether Treasury yields will turn lower after filling the gap. But with the Federal Reserve’s monetary policy still hawkish and geopolitical conflict in the Middle East showing no signs of easing, macroeconomic pressures on risk assets remain in place.
Turning to Bitcoin’s technical picture, last week’s candle was a long, high-volume bearish candle with a solid body, and it broke below the critically important 200-week moving average. Looking back at recent price action, Bitcoin had only broken below this moving average once before, at $57,000. At the time, with the realized cost basis at $53,000 and the average cost basis of large holders at $48,000, most people were afraid to buy the dip and missed the subsequent rally. The core trading logic is now very clear: if this week’s candle also closes bearish below the key 200-day/200-week moving averages, and Bitcoin breaks below $57,000, the previous rally will be definitively classified as a “fake bull market” and a bull trap. Price will most likely seek support in the $53,000 range, or potentially fall much further. At that point, we will have to turn fully bearish.
However, if we look to the daily and lower time frames for signs of a bottom, the market still has a fighting chance. After a wick swept liquidity near the parallel lows at $62,000, price formed a quick Pin Bar and is now potentially developing a large-scale inverse head-and-shoulders structure. Yesterday morning, as global assets fell across the board and the market was gripped by extreme fear, I clearly outlined two potential signals of a bottom in our public Telegram (TG) group: either a high-volume Pin Bar at the bottom or the formation of multiple bases over time. At around 10:20 yesterday morning, a 4-hour Pin Bar formed as expected. Price precisely retested the 0.382 level and touched the $61,000–$62,000 liquidity zone, so we entered some long positions after the candle close confirmed the setup.

Several data points are converging in support of a short-term bullish outlook. First, funding rates across major platforms have turned negative, and bearish sentiment is becoming increasingly crowded even amid a slight rebound, making it extremely unfavorable to chase shorts at this point. Second, the liquidation map shows that $1,000 above the current price ($65,100), at $66,100, sits a cluster of short liquidations totaling as much as $560 million, while long liquidations below, at $64,100, total only $370 million. A liquidity sweep to the upside would better serve the interests of major players. Finally, the price action and futures CVD indicators are showing clear signs of a bullish divergence at the lows. The first target for a short-term rebound is $66,500, where support and resistance switch and liquidations are concentrated. If the rebound is strong enough, price could fill the overhead gap between $71,000 and $72,000. Only after price has had sufficient time to consolidate, absorb the liquidity shock, and reclaim $72,000 will we be able to confirm that the bull market is back.
III. Tracing the Weekend Plunge and Warning of a Second Nasdaq Bottom
A plunge this severe in Bitcoin over a weekend, when liquidity is usually thin, must point to a major external liquidity withdrawal. In our VIP community, I took an in-depth look at two potential triggers: first, the market has begun pricing in a renewed increase in expectations for Fed rate hikes in 2027; second, AI giant Anthropic’s sixfold oversubscription has created a powerful siphoning effect on global risk capital. When multiple factors converge and global liquidity suddenly tightens, Bitcoin—with its massive market capitalization and 24/7 trading—is often the first asset to be used as an “ATM.”
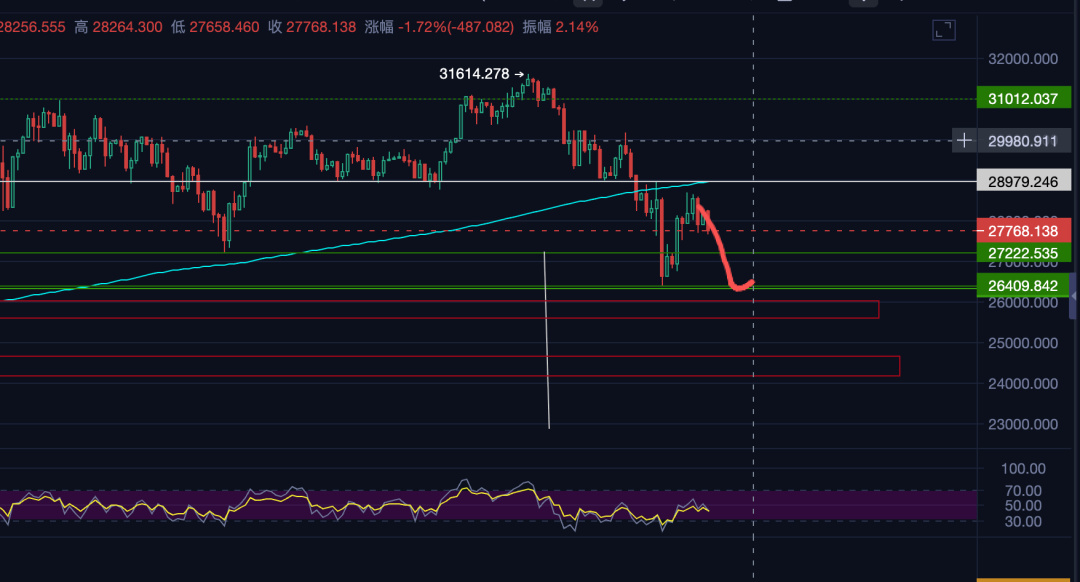
Fortunately for the crypto market, the current selling pressure is not targeting cryptocurrencies alone. After recovering from a false breakdown, the Nasdaq Index is now facing a double test of its 200-day moving average and a support-turned-resistance level. Nasdaq futures are already showing a clear premarket downtrend. Since U.S. markets are closed over the weekend, institutions facing a liquidity crunch can only pull funds out of crypto markets first. Once U.S. markets open tonight (evening in UTC+8), the accumulated bearish sentiment will be fully released as passive funds and retail counterparties enter the market. We are therefore issuing a strong warning that the Nasdaq could see a substantial second leg down after the U.S. market opens tonight. The risk of spillover between U.S. tech stocks and crypto markets remains high.
IV. Shifting Fortunes Among Tech Giants: Nvidia’s Crisis After Jensen Huang’s Departure and Shorting Opportunities in the AI Supply Chain
The biggest recent wildcard for U.S. tech stocks has been the turmoil at Nvidia. Following news of Jensen Huang’s departure, Nvidia shares fell to $149. The market briefly saw this as a “golden opportunity” after the bad news was priced in, driving the stock back up to $169. At the time, I clearly advised everyone to sell decisively at $169. Sure enough, bearish sentiment toward Nvidia continued to spread in the weekend’s after-hours market.
Many investors have tried to compare Jensen Huang’s departure to Steve Jobs leaving Apple, arguing that Nvidia can still sustain a long-term bull market. But in an in-depth review in our VIP group, I pointed out the fundamental difference between the two cases. Jobs was not only a “time teller” but also an exceptional “clockmaker.” He built a strong corporate culture, a product moat, and a well-developed succession pipeline at Apple, allowing Cook, as a steady steward, to lead the company through nearly two decades of growth. By contrast, Huang has adopted an extremely flat management structure at Nvidia, directly overseeing more than 50 vice presidents. It is very difficult for the company to find a leader like Cook, with a comprehensive grasp of the business and the ability to plan strategically. The new interim CEO, Colette Kress, was previously CFO, with expertise focused mainly on supply chain and finance. Therefore, until Huang officially says “I’m back” and returns, I remain firmly bearish on Nvidia’s medium- to long-term outlook. As for the specific trading strategy, if Nvidia retests the $150 area after the U.S. market opens tonight, I may consider buying the dip for a short-term trade on a brief rebound around its November 17 earnings release, then exit decisively.
More importantly, Huang’s departure not only weakens Nvidia’s own core moat but also has far-reaching implications for the entire AI supply chain. In the past, under Huang’s leadership, Nvidia supported numerous AI model labs through dedicated funds, helping the open-source ecosystem flourish and, in turn, supporting financing and expansion among AI infrastructure firms and upstream hardware suppliers. With this key strategic link broken, the valuation logic for AI hardware and memory stocks is facing a reset. Based on this analysis, I opened a short position in SanDisk in our VIP community last Friday, giving a precise entry near $950 and a stop loss at $1,065. The position is now open and has generated unrealized gains. SanDisk’s continued weakness after its rebound stalled also indirectly confirms that the Nasdaq will likely experience at least one more retest of the lows.
V. Gold Outlook: Key Levels and Time Windows to Watch
Finally, turning to the gold market, I have also entered a short position. Looking back at recent price action, after falling sharply in the previous sell-off, gold rebounded toward its previous high and descending trendline, where it was rejected and turned lower again. It then moved sideways repeatedly after breaking below key support, making it rather unclear whether the area around $3,800 marks a short-term bottom.
From a macro perspective, as long as the 10-year Treasury yield fails to turn lower and the Fed maintains its hawkish stance, there is a strong macro basis for shorting gold. In terms of managing the trade, I have set clear trading rules and a line in the sand between bulls and bears. On the one hand, if gold decisively reclaims $4,160 and holds above the descending trendline, I will abandon my short-term bearish bias entirely and even prepare for an upside liquidity sweep. On the other hand, for my current short position, I have set 16:00 this afternoon as a key time window. Before then, if gold breaks below $3,850, I will continue holding the short and let profits run. If it fails to break below that level decisively, I will close the position without hesitation to avoid the risks of choppy trading.
Although candlesticks contain all market information, skilled traders need to be “half a step ahead” of them: form an objective bias 15 to 30 minutes in advance by combining macroeconomic conditions, capital flows, and market structure, and prepare a rigorous contingency plan. That is how to stay ahead in the unpredictable world of cross-asset correlations.