【$BTC Four-Year Cycle Series 88】
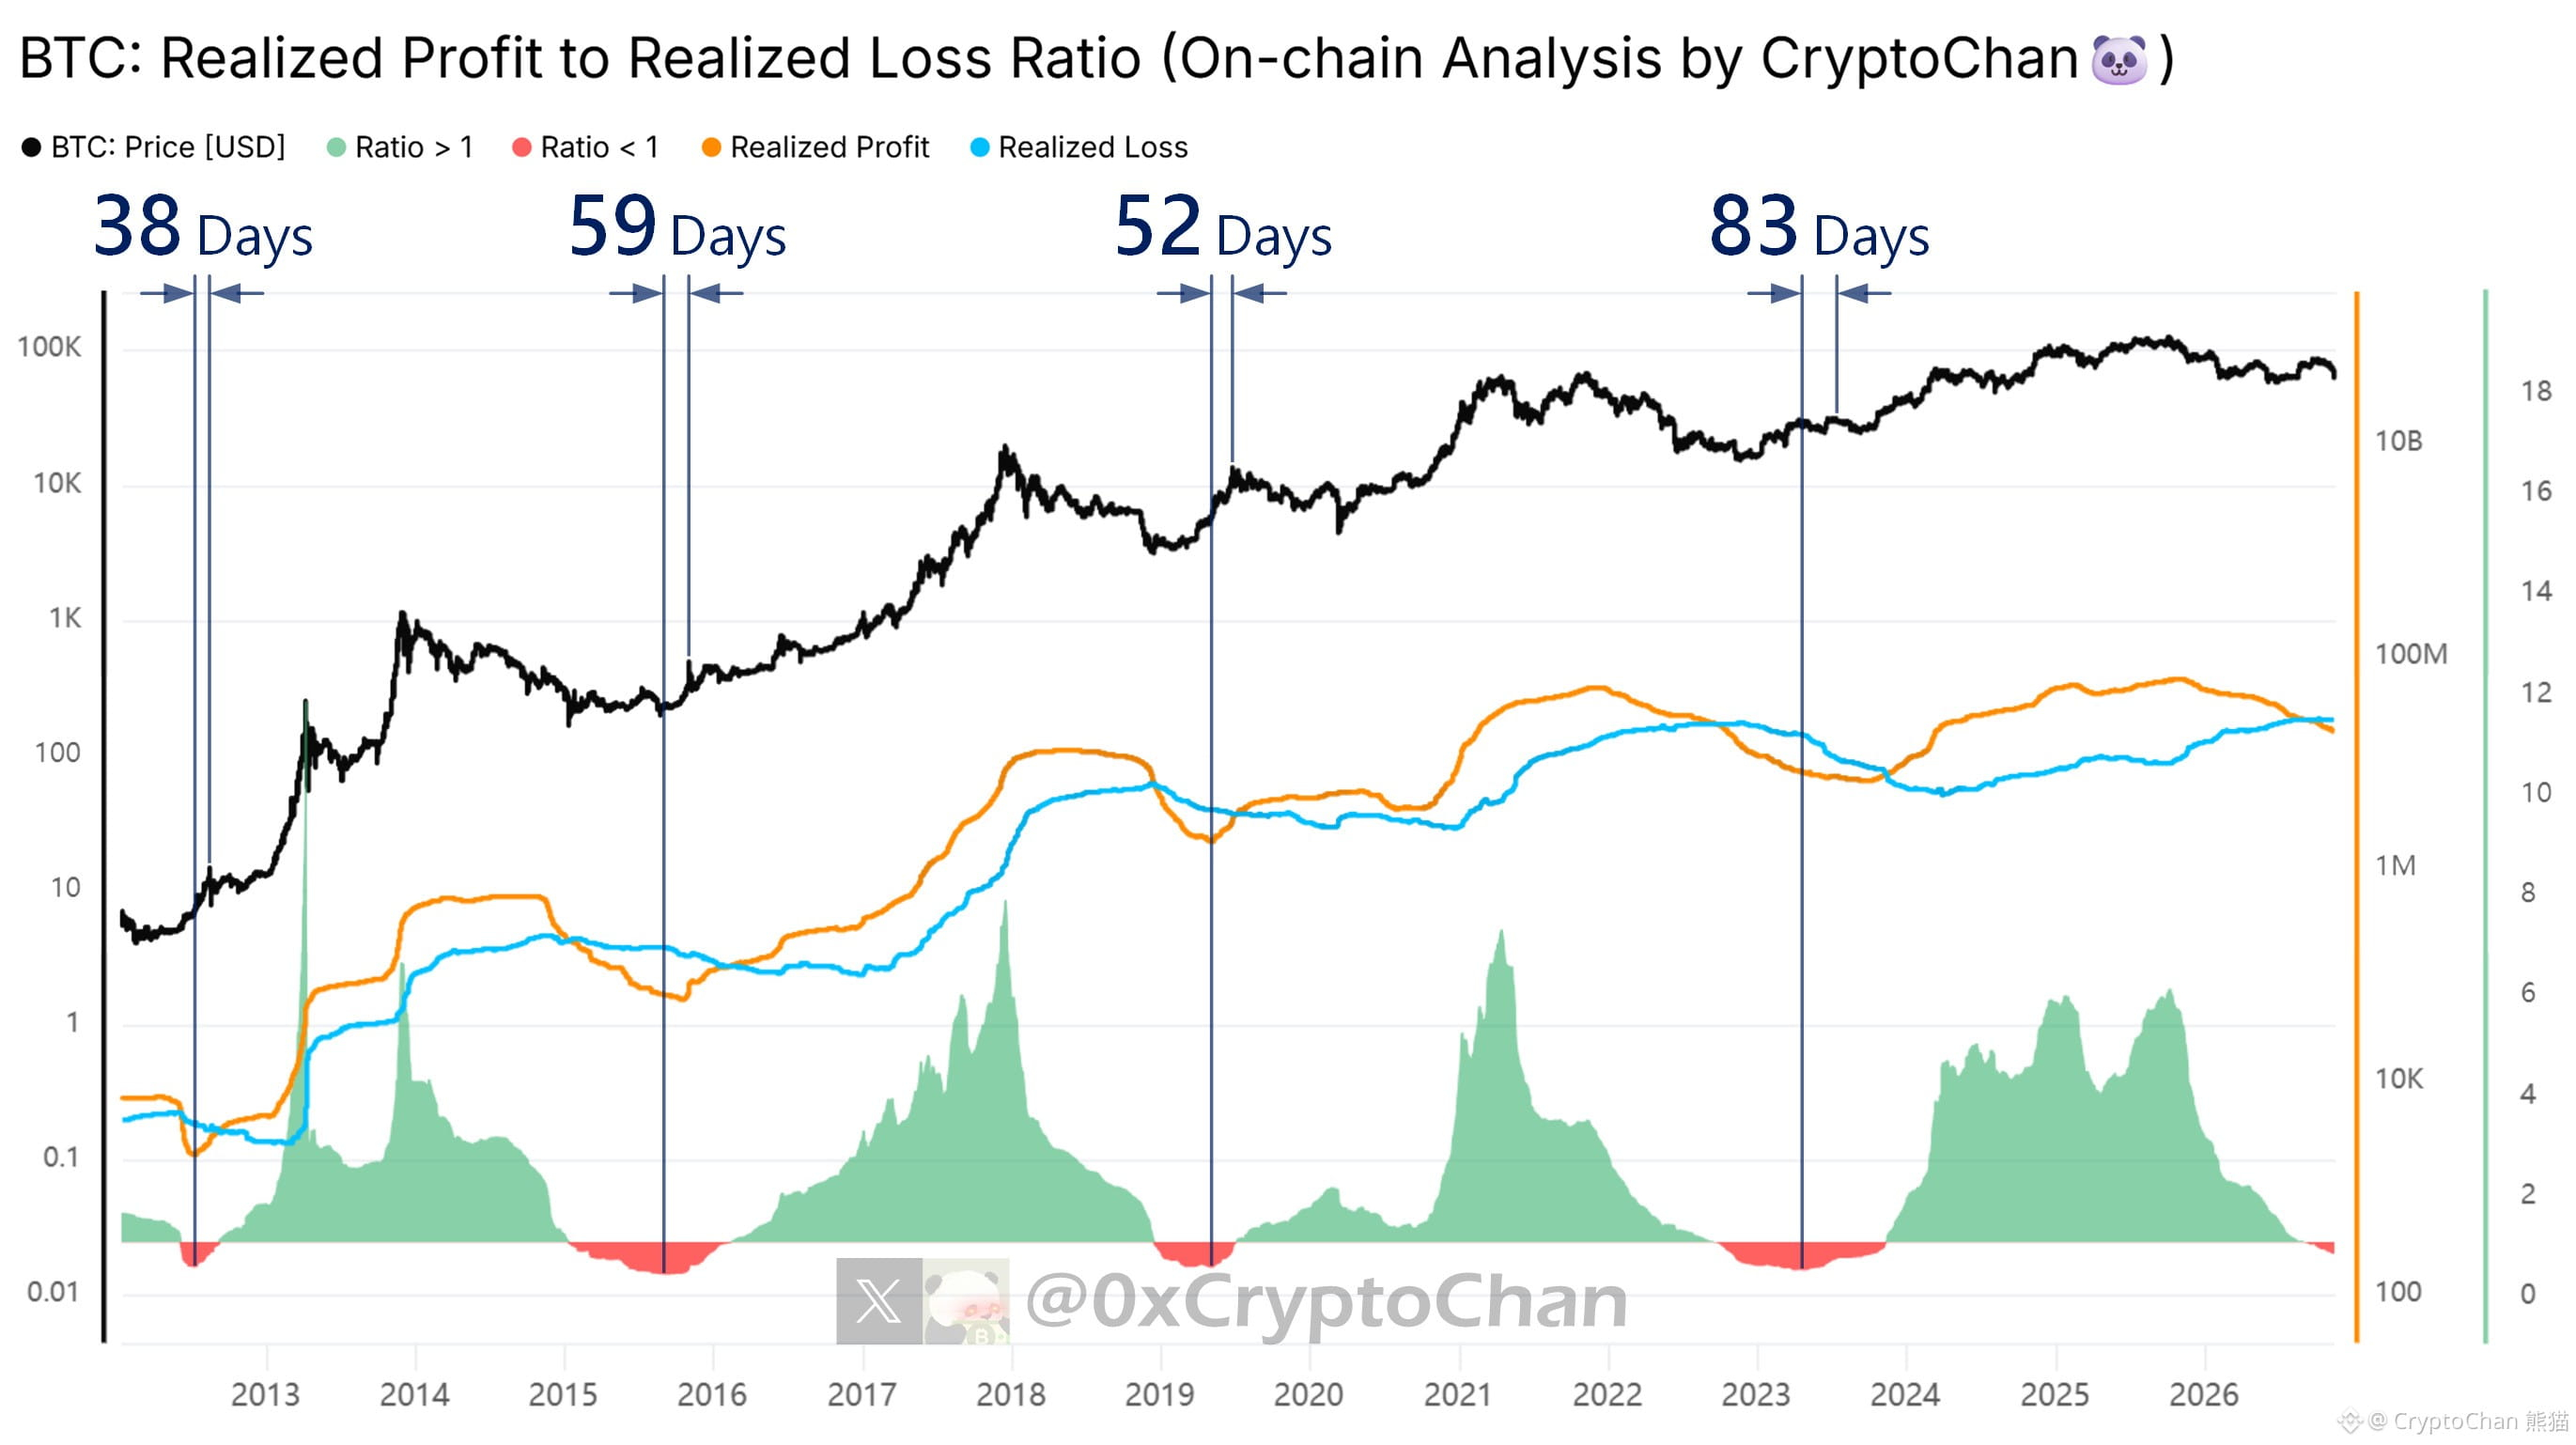
2012 red bars bottomed: 38 days later, the bull market recovery peak
2015 red bars bottomed: 59 days later, the bull market recovery peak
2019 red bars bottomed: 52 days later, the bull market recovery peak
2023 red bars bottomed: 83 days later, the bull market recovery peak
┌── 🐼 On-chain Data Details ──┐
Black line: BTC price
Orange line: BTC on-chain realized profits, 365DMA
Blue line: BTC on-chain realized losses, 365DMA
Green bars: orange-to-blue ratio (>1)
Red bars: orange-to-blue ratio (<1)
2012 red bars bottomed: 38 days later, the bull market recovery peak
2015 red bars bottomed: 59 days later, the bull market recovery peak
2019 red bars bottomed: 52 days later, the bull market recovery peak
2023 red bars bottomed: 83 days later, the bull market recovery peak
┌── 🐼 On-chain Data Details ──┐
Black line: BTC price
Orange line: BTC on-chain realized profits, 365DMA
Blue line: BTC on-chain realized losses, 365DMA
Green bars: orange-to-blue ratio (>1)
Red bars: orange-to-blue ratio (<1)