
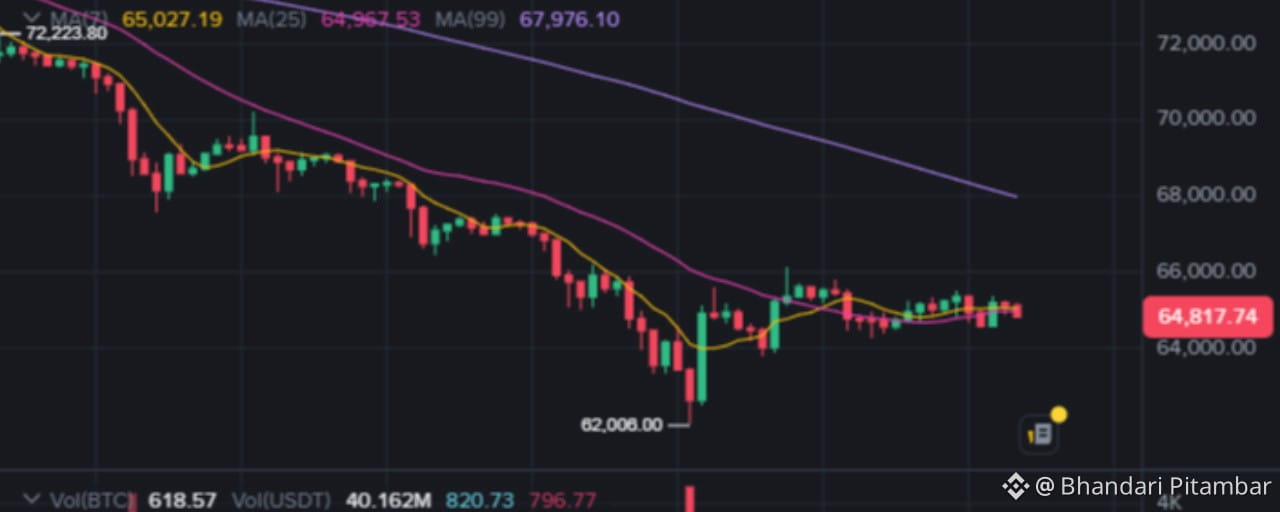

Verdict: SIDEWAYS inside 62,008–66,000, with directional bias decided only at the edges. Calling PUMP or DUMP from 64,817 mid-coil is a coin flip dressed as analysis.
Key levels (chart-derived):
Resistance 1: 65,000–65,200 (MA7/MA25 cluster + today's high 65,190)
Resistance 2: ~65,500–66,000 (bounce-high zone, visual estimate)
Resistance 3 / trend flip: 67,976 (1H MA99) confluence with the prior breakdown shelf ~67,500–68,000
Support 1: ~64,000–64,300 (consolidation floor / higher-low zone)
Support 2: 62,008 (swing low, invalidation of the base thesis)
Support 3: 60,000 psychological (extension target if 62,008 fails)
Scenarios & triggers:
Bullish trigger: 1H close above 65,200 on expanding volume → targets 66,000, then 67,900–68,000. Invalidation: fall back below 64,300.
Bearish trigger: 1H close below 64,000 → retest 62,008; loss of 62,008 opens 60,000–61,000. Invalidation: reclaim of 65,200.
Base case (highest probability): continued 64,000–65,200 coil until a macro/flow catalyst forces edge resolution.
Outlook:
Short-term (days): sideways, expansion imminent given 0.60% candle range.
Medium-term (weeks): bearish while below 67,976; structurally neutral only on a sustained close above ~68,000.
Strongest/weakest majors: with only BTC and BNB charts verified this session, both show identical grammar (impulse down, low-volume coil, price under descending MA99). Neither is a bullish standout; BTC is the relatively stronger of the two solely because its bounce held a cleaner higher low. I will not rank coins I have not seen charts for — that would be invention.
BINANCE SQUARE ARTICLE
Bitcoin at $64,817: The Tightest Coil in Weeks Is Loading — and Mid-Range Is the Worst Seat in the House
Bitcoin closed the hour at $64,817.74, down 0.45%, squeezed into a 0.60% range — the tightest compression since the flush to $62,008 two weeks of candles ago. Everyone wants to know if this is a base or a bear flag. The honest answer: from mid-range, it's neither yet. It's a coil, and coils don't pay opinions — they pay edge-traders.
Market Overview: A Defensive Tape, Not a Rotation Tape
BTC's slide from $72,223.80 to $62,008 (-14.15%) didn't happen in a vacuum. With the Fed's December decision approaching and the dollar refusing to surrender strength, risk assets are being priced for patience, not euphoria. Capital isn't rotating into alts — it's concentrating in BTC and stablecoins, the classic signature of a defensive market. Until ETF flows and exchange netflows confirm institutional re-engagement, every rally claim should be treated as unproven.
The Chart: What's Real and What's Wishful
Real: the 62,008 low printed with the session's largest volume and a long rejection wick — forced selling met passive bids. Since then, bears have failed to make a new low, and the pullback held a higher low.
Wishful: calling this accumulation. Volume has dried up through the entire consolidation, and price just slipped below its short-term means (MA7 at 65,027.19, MA25 at 64,967.53). Overhead, the descending MA99 at 67,976.10 — nearly 5% away — remains the line between "bounce" and "trend repair."
Bullish vs. Bearish Scenarios
Bulls need: a 1H close above 65,200 on expanding volume. That unlocks the bounce-high zone (~65,500–66,000) and puts the MA99 shelf at 67,900–68,000 in play. Bull thesis dies back below 64,300.
Bears need: a 1H close below 64,000. That re-opens 62,008; losing 62,008 points the tape at the 60,000 psychological floor. Bear thesis dies on a reclaim of 65,200.
Most likely: more coil. Ranges this compressed resolve violently — usually into the nearest liquidity pool, i.e., above 66,000 shorts or below 62,008 longs.
Whale & Institutional Footprints: One Clue, No Confirmation
The only verified smart-money trace is the absorption wick at 62,008 on peak volume. Everything else — ETF flows, exchange outflows, wallet clustering — is currently unconfirmed in this analysis, and you should distrust anyone quoting precise numbers without a live source. What we can say: institutions accumulate at impulse lows with limit orders. They do not chase mid-range coils. Behave accordingly.
Key Levels Cheat Sheet
R1: 65,000–65,200 | R2: ~65,500–66,000 | R3 (trend flip): 67,976–68,000
S1: 64,000–64,300 | S2: 62,008 | S3: 60,000
Final Prediction
SIDEWAYS with a bearish tilt below 67,976. Expect continued 64,000–65,200 chop until macro catalysts (December Fed window, US data) force a resolution. Positioning mid-range offers the worst risk/reward on the chart; the edges offer tradable asymmetry. No guarantees — invalidation levels above are your contract with reality.
The Bottom Line
This market isn't asking you to predict. It's asking you to wait for 65,200 or 64,000 to break, then act without hesitation. The traders who survive coils are the ones who let the range vote first.
Where does this coil resolve — 66K squeeze or 62K retest? Drop your level in the comments.
#BTC #Bitcoin #CryptoMarket #TechnicalAnalysis #TradingStrategy
