
🚀 EVAA stands its ground: +94% and hot liquidity zones!
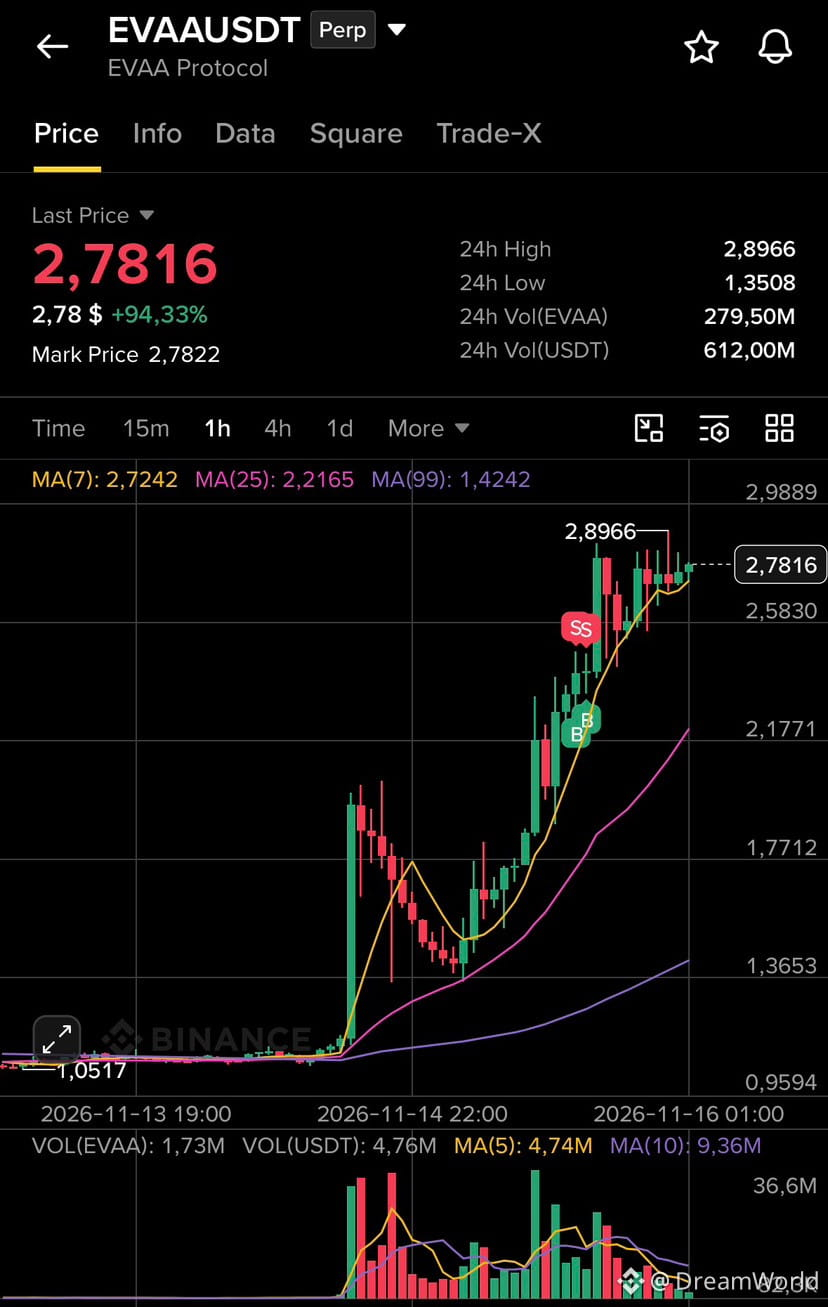
EVAA continues to maintain a powerful bullish trend. After testing a local high at $2.8966, the price settled near $2.7816. Daily trading volumes are enormous: 279.5M EVAA and more than 612M USDT in circulation. The market is heating up, and there’s plenty to look at on the charts.
📊 What the technicals and clusters show:
Trend and moving averages: The price is holding firmly above key MA(7) — $2.72 and MA(25) — $2.21. Momentum is holding, and buyers are in control.
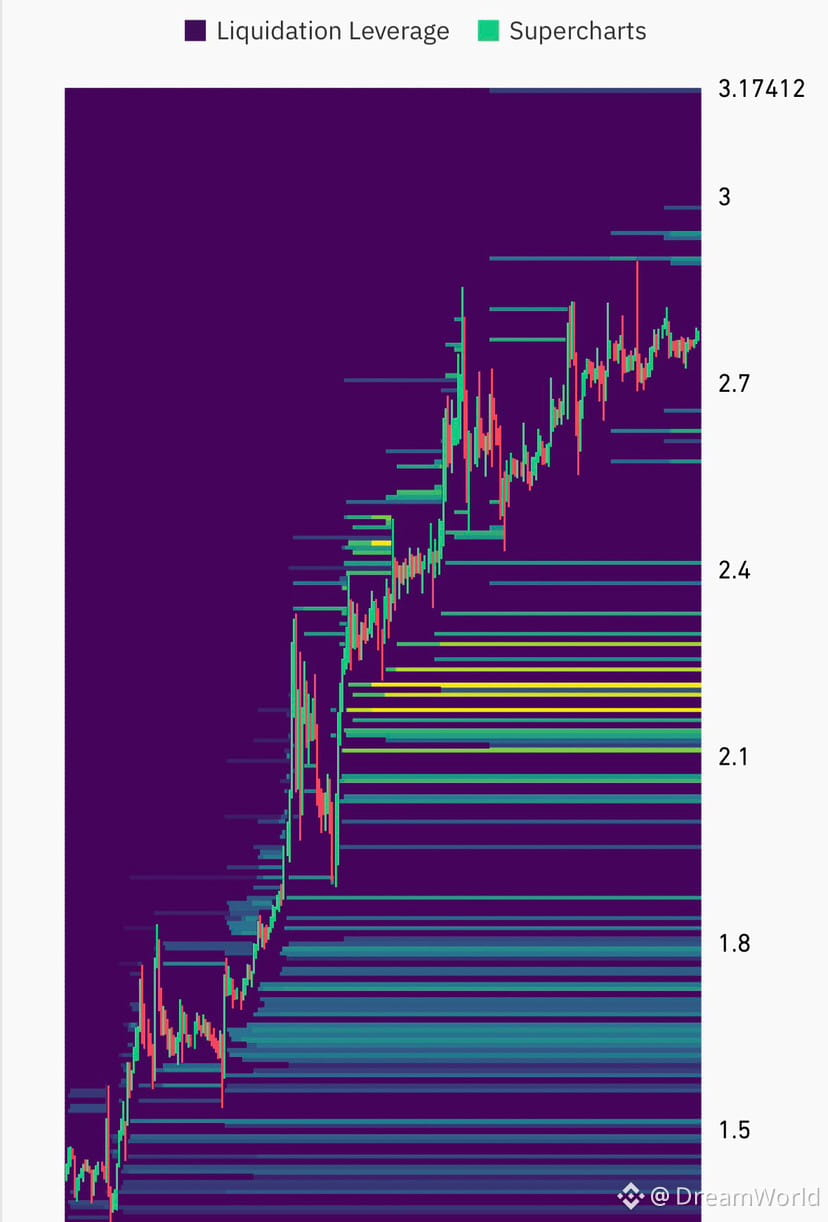
Liquidation map: Large volumes have accumulated, with dense liquidity concentrated in the $2.10–$2.30 range (yellow and green clusters on the heat map). This is where large players built their positions.
Upside targets: Untapped short liquidity remains above current levels. If we break the local high, the way is clear to the psychological $3.00–$3.17 level.
⚠️ With such sharp moves, it’s important to keep risk under control and avoid jumping in at the highs without local confirmation.
What’s your take on EVAA? Waiting for a break above $3, or getting ready to buy the retest? Let us know in the comments! 👇
#EVAA
EVAA continues to maintain a powerful bullish trend. After testing a local high at $2.8966, the price settled near $2.7816. Daily trading volumes are enormous: 279.5M EVAA and more than 612M USDT in circulation. The market is heating up, and there’s plenty to look at on the charts.
📊 What the technicals and clusters show:
Trend and moving averages: The price is holding firmly above key MA(7) — $2.72 and MA(25) — $2.21. Momentum is holding, and buyers are in control.
Liquidation map: Large volumes have accumulated, with dense liquidity concentrated in the $2.10–$2.30 range (yellow and green clusters on the heat map). This is where large players built their positions.
Upside targets: Untapped short liquidity remains above current levels. If we break the local high, the way is clear to the psychological $3.00–$3.17 level.
⚠️ With such sharp moves, it’s important to keep risk under control and avoid jumping in at the highs without local confirmation.
What’s your take on EVAA? Waiting for a break above $3, or getting ready to buy the retest? Let us know in the comments! 👇
#EVAA