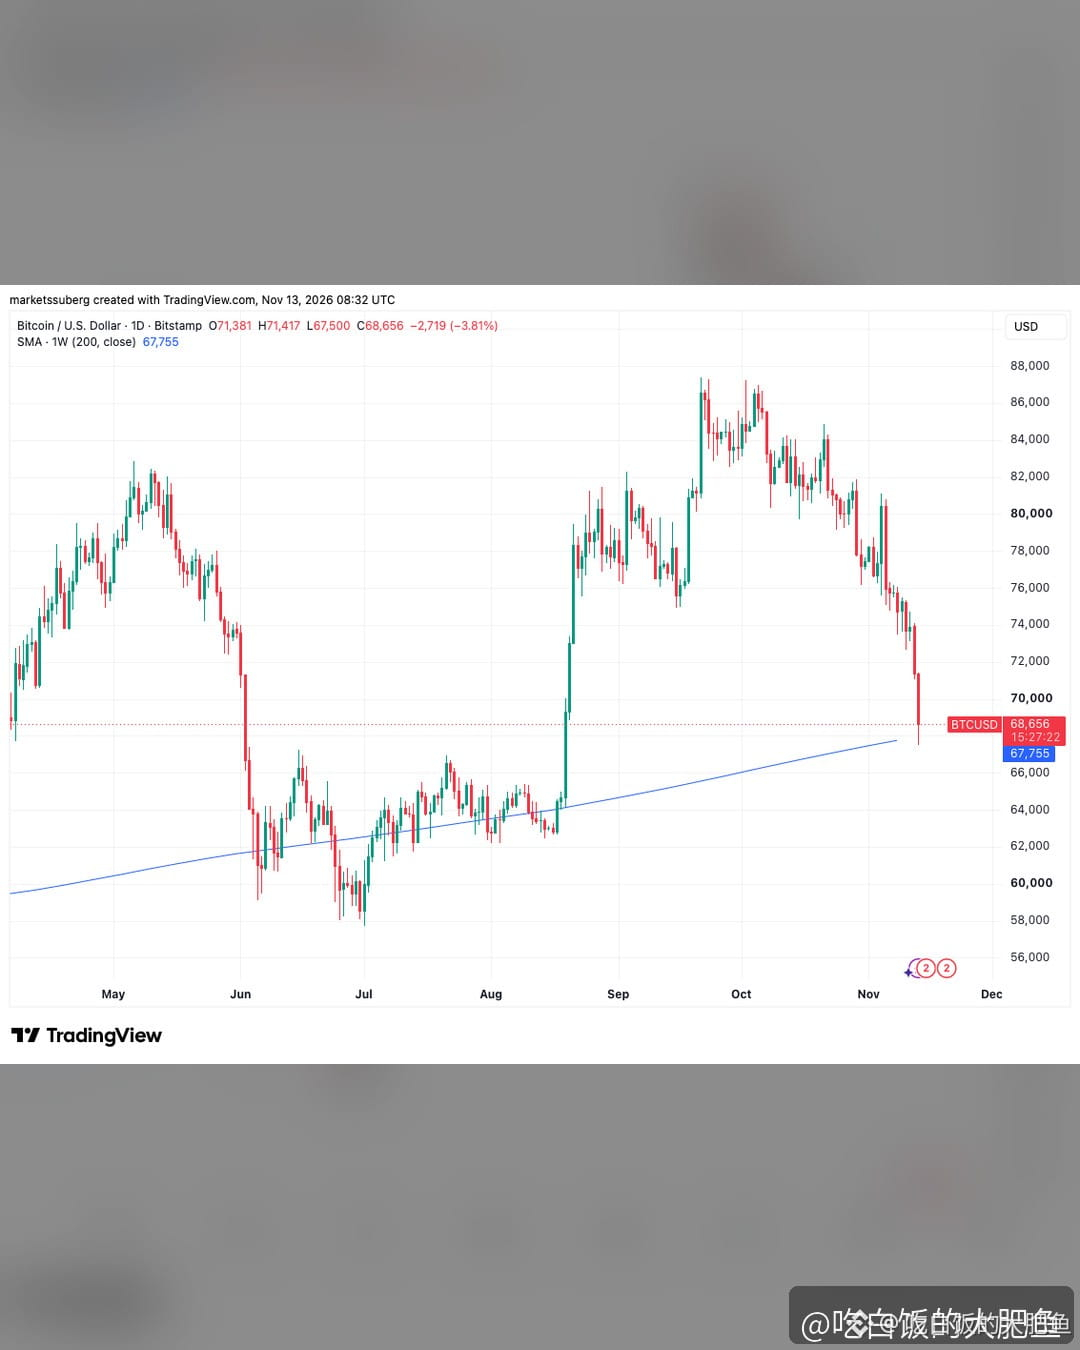
A line that held for four years broke in a single Friday—with only about 6 hours left until the weekly close, $BTC is still below the 200-week moving average.
The 200-week moving average is now around $67,800. On Friday, BTC dropped to a low of $67,500, touching this line for the first time in 11 weeks. Over the weekend, it fell further to $62,006, its lowest level since August, bounced back to $66,960, then slid again. It’s now around $64,600. U.S. spot ETFs have seen net outflows for seven straight trading days, and the Fear & Greed Index is down to 13.
This line has served as a reference for bear-market bottoms: prices hovered around it from March to October 2023, and again from June to August this year. But the line itself won’t act as support—in 2022, it also flipped into resistance for a while. I’ll set my own interests aside for now: the key isn’t whether it broke on Friday, but where the weekly candle closes at 8 a.m. today. A close back above $68,000 would make this a false breakdown; a close below would turn a four-year floor into a ceiling. The first level to watch below is $62,006, followed by the $57,700 area mentioned by analysts. Let’s see the close first, then talk direction.
The 200-week moving average is now around $67,800. On Friday, BTC dropped to a low of $67,500, touching this line for the first time in 11 weeks. Over the weekend, it fell further to $62,006, its lowest level since August, bounced back to $66,960, then slid again. It’s now around $64,600. U.S. spot ETFs have seen net outflows for seven straight trading days, and the Fear & Greed Index is down to 13.
This line has served as a reference for bear-market bottoms: prices hovered around it from March to October 2023, and again from June to August this year. But the line itself won’t act as support—in 2022, it also flipped into resistance for a while. I’ll set my own interests aside for now: the key isn’t whether it broke on Friday, but where the weekly candle closes at 8 a.m. today. A close back above $68,000 would make this a false breakdown; a close below would turn a four-year floor into a ceiling. The first level to watch below is $62,006, followed by the $57,700 area mentioned by analysts. Let’s see the close first, then talk direction.