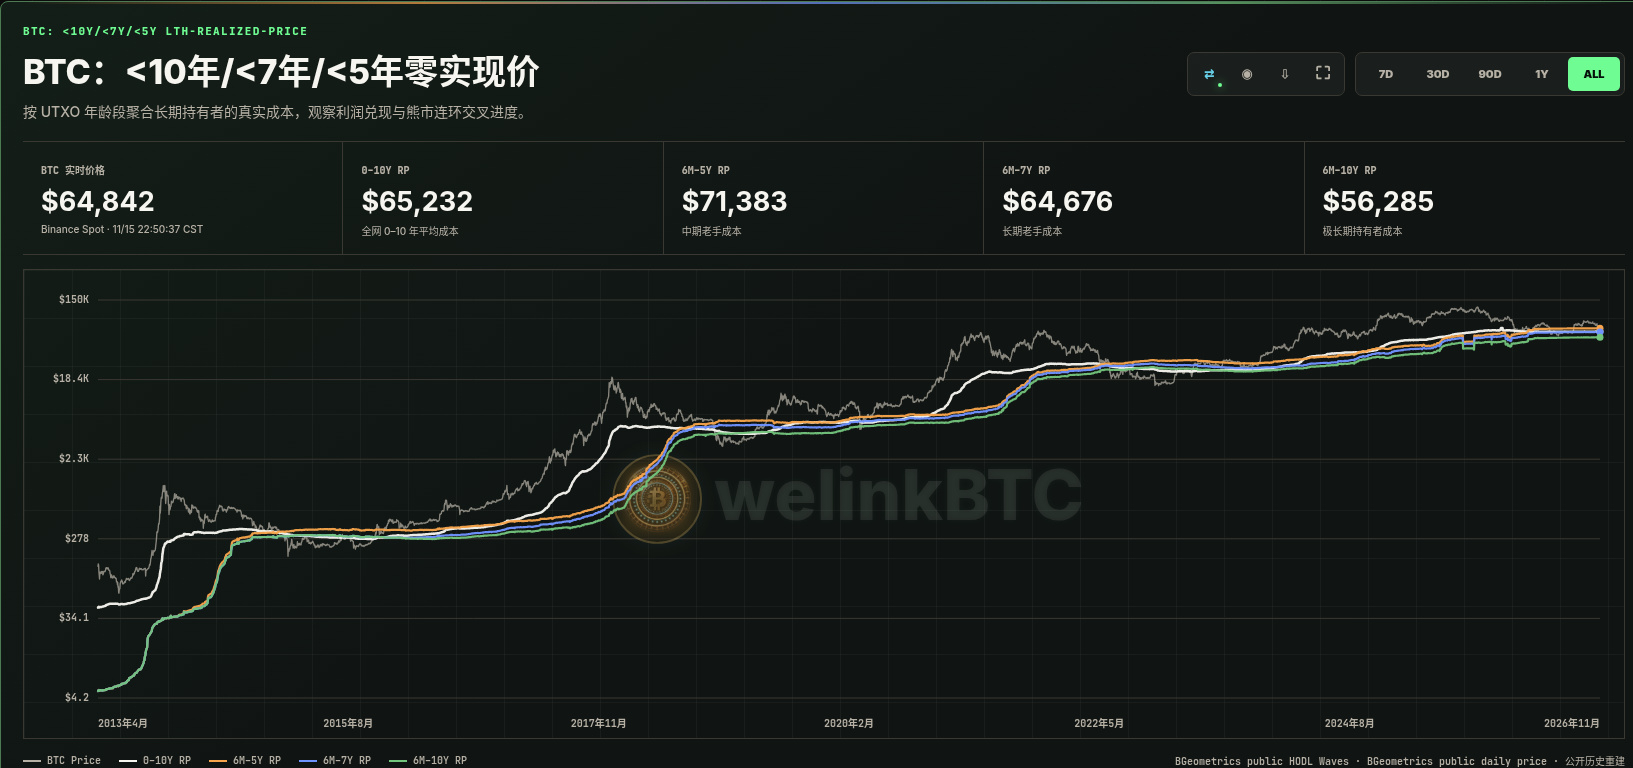
BTC: <10-year/<7-year/<5-year realized price
Long-term holders’ cost basis indicates that the market is still in a “high-risk, cost mean-reversion” phase, with only one-third of the sequence of crossovers complete.
As of 2026-11-14, BTC is around $64,842, above 2 of the 4 age-band cost basis lines. The 0–10-year realized price is $65,232, the 6-month–5-year cost basis is $71,383, the 6-month–7-year cost basis is $64,676, and the 6-month–10-year cost basis is $56,285. The current price is about 9.2% below the cost basis of mid-term veterans, and the 0–10-year benchmark has completed 1/3 of its downward crossovers.
How should you read this indicator? The 0–10-year realized price represents the aggregate cost basis of coins active within the past decade. The 6-month–5-year, 6-month–7-year, and 6-month–10-year realized prices progressively extend the long-term holder window, helping track profit-taking phases and the sequence of crossovers at bear-market bottoms.
During the deep capitulation phase of past bear markets, the 0–10-year benchmark cost basis crosses below the 6-month–5-year, 6-month–7-year, and 6-month–10-year cost basis lines in sequence. Only once all three crossovers are complete is the market closer to a macro bottom structure following a thorough transfer of coins. The benchmark line is currently still above the 6-month–7-year and 6-month–10-year cost basis lines, suggesting the market is closer to profit-taking than to a final capitulation.
The current price has fallen below the 0–10-year benchmark and mid-term cost basis, but remains above the longer-term cost basis. Next, watch whether this sequence of crossovers continues to unfold, and whether spot demand and liquidity pick up in tandem.
More selected on-chain cycle indicators
Portal: https://welinkbtc-onchainmain.xyz/
Understand market cycles like a professional analyst
$BTC
Long-term holders’ cost basis indicates that the market is still in a “high-risk, cost mean-reversion” phase, with only one-third of the sequence of crossovers complete.
As of 2026-11-14, BTC is around $64,842, above 2 of the 4 age-band cost basis lines. The 0–10-year realized price is $65,232, the 6-month–5-year cost basis is $71,383, the 6-month–7-year cost basis is $64,676, and the 6-month–10-year cost basis is $56,285. The current price is about 9.2% below the cost basis of mid-term veterans, and the 0–10-year benchmark has completed 1/3 of its downward crossovers.
How should you read this indicator? The 0–10-year realized price represents the aggregate cost basis of coins active within the past decade. The 6-month–5-year, 6-month–7-year, and 6-month–10-year realized prices progressively extend the long-term holder window, helping track profit-taking phases and the sequence of crossovers at bear-market bottoms.
During the deep capitulation phase of past bear markets, the 0–10-year benchmark cost basis crosses below the 6-month–5-year, 6-month–7-year, and 6-month–10-year cost basis lines in sequence. Only once all three crossovers are complete is the market closer to a macro bottom structure following a thorough transfer of coins. The benchmark line is currently still above the 6-month–7-year and 6-month–10-year cost basis lines, suggesting the market is closer to profit-taking than to a final capitulation.
The current price has fallen below the 0–10-year benchmark and mid-term cost basis, but remains above the longer-term cost basis. Next, watch whether this sequence of crossovers continues to unfold, and whether spot demand and liquidity pick up in tandem.
More selected on-chain cycle indicators
Portal: https://welinkbtc-onchainmain.xyz/
Understand market cycles like a professional analyst
$BTC