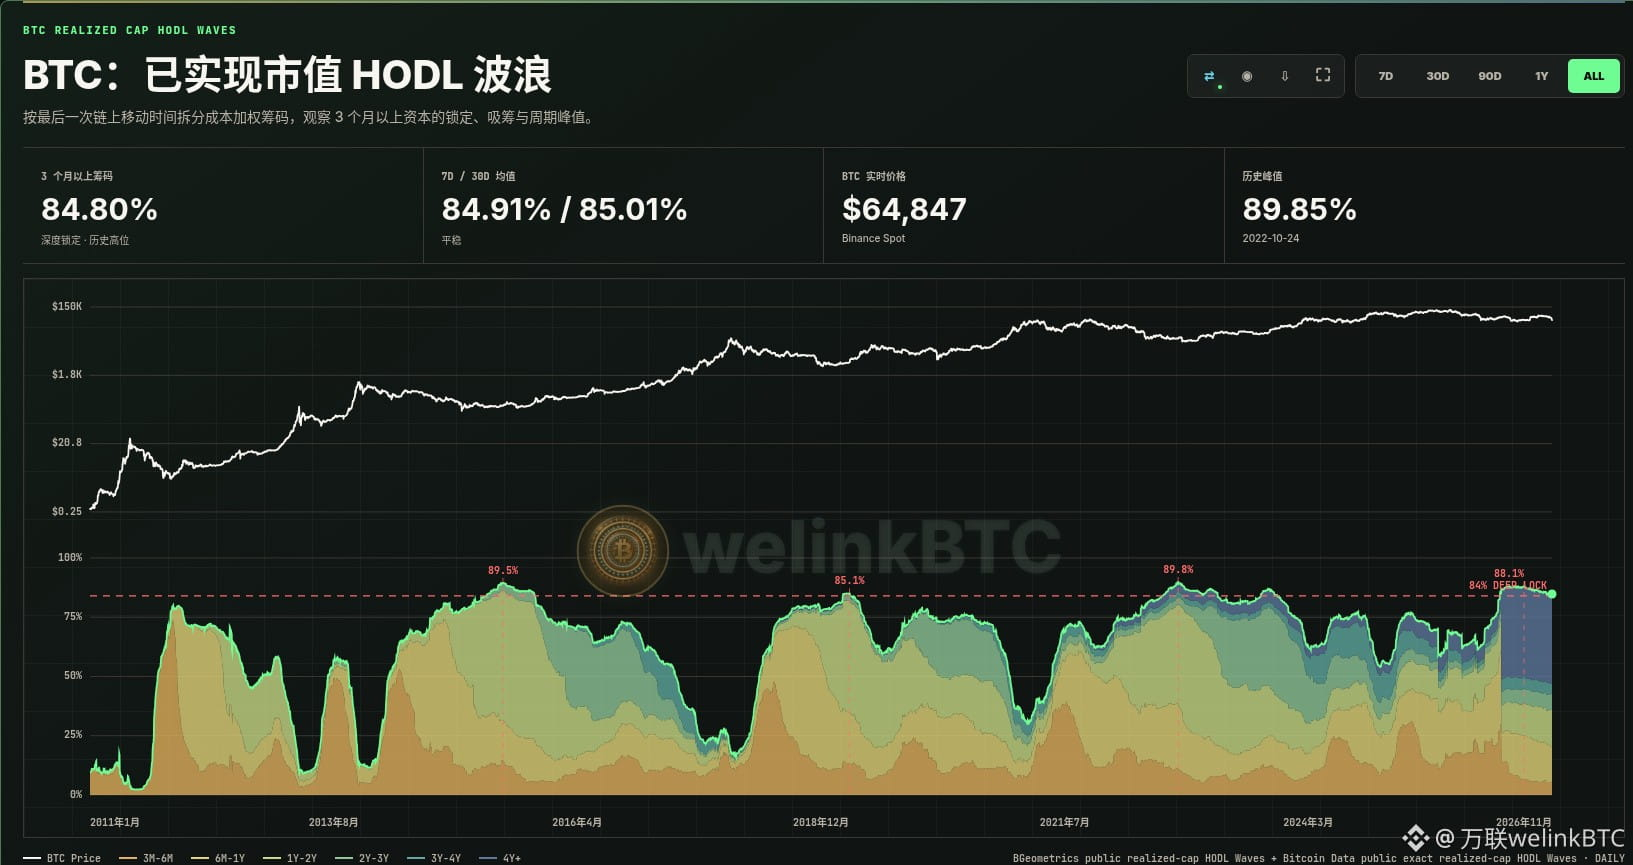
BTC: Realized Cap HODL Waves
Cost-weighted coins held for more than 3 months have entered the “deep HODLing” zone and are near historical highs.
As of 2026-11-14, coins held for more than 3 months accounted for 84.80%, 0.80% above the 84% deep HODLing benchmark. The 7-day average was 84.91%, the 30-day average was 85.01%, and the 7-day change was approximately -0.10%, indicating a stable short-term trend. The cycle peak occurred on 2026-07-26, when this share reached 88.10%. The BTC reference price is approximately $64,847.
How should you read this indicator? Realized Cap HODL Waves weight each bitcoin by the price at which it last moved on-chain, then group it by how long it has been dormant. Rather than simply counting the number of coins, this offers a clearer view of how capital costs shift between short-term traders and long-term holders.
Below 60%, short-term capital is more active; 60%–75% is a balanced zone where accumulation and liquidity coexist; 75%–84% corresponds to long-term accumulation and a shrinking active supply; at or above 84%, the market enters deep HODLing, a level often used to assess cycle bottoms and supply shocks. Historically, several highs occurred on 2015-06-26 (89.48%, BTC at approximately $243), 2019-03-31 (85.08%, approximately $4,094), and 2022-10-24 (89.85%, approximately $19,341). These mostly fell in the later stages of accumulation, following extensive bear-market turnover.
A high HODLing share describes the state of the supply side; it does not guarantee an immediate price rise. When this share remains high, the supply available for short-term trading is usually lower, making price movements more sensitive to new demand. A rapid decline, on the other hand, indicates that older coins are becoming active again, so distribution and turnover should be monitored. A more prudent approach is to consider this metric alongside spot demand, global liquidity, and realized profit and loss.
More curated on-chain cycle indicators
Portal: https://welinkbtc-onchainmain.xyz/
Understand market cycles like a professional analyst
$BTC
Cost-weighted coins held for more than 3 months have entered the “deep HODLing” zone and are near historical highs.
As of 2026-11-14, coins held for more than 3 months accounted for 84.80%, 0.80% above the 84% deep HODLing benchmark. The 7-day average was 84.91%, the 30-day average was 85.01%, and the 7-day change was approximately -0.10%, indicating a stable short-term trend. The cycle peak occurred on 2026-07-26, when this share reached 88.10%. The BTC reference price is approximately $64,847.
How should you read this indicator? Realized Cap HODL Waves weight each bitcoin by the price at which it last moved on-chain, then group it by how long it has been dormant. Rather than simply counting the number of coins, this offers a clearer view of how capital costs shift between short-term traders and long-term holders.
Below 60%, short-term capital is more active; 60%–75% is a balanced zone where accumulation and liquidity coexist; 75%–84% corresponds to long-term accumulation and a shrinking active supply; at or above 84%, the market enters deep HODLing, a level often used to assess cycle bottoms and supply shocks. Historically, several highs occurred on 2015-06-26 (89.48%, BTC at approximately $243), 2019-03-31 (85.08%, approximately $4,094), and 2022-10-24 (89.85%, approximately $19,341). These mostly fell in the later stages of accumulation, following extensive bear-market turnover.
A high HODLing share describes the state of the supply side; it does not guarantee an immediate price rise. When this share remains high, the supply available for short-term trading is usually lower, making price movements more sensitive to new demand. A rapid decline, on the other hand, indicates that older coins are becoming active again, so distribution and turnover should be monitored. A more prudent approach is to consider this metric alongside spot demand, global liquidity, and realized profit and loss.
More curated on-chain cycle indicators
Portal: https://welinkbtc-onchainmain.xyz/
Understand market cycles like a professional analyst
$BTC