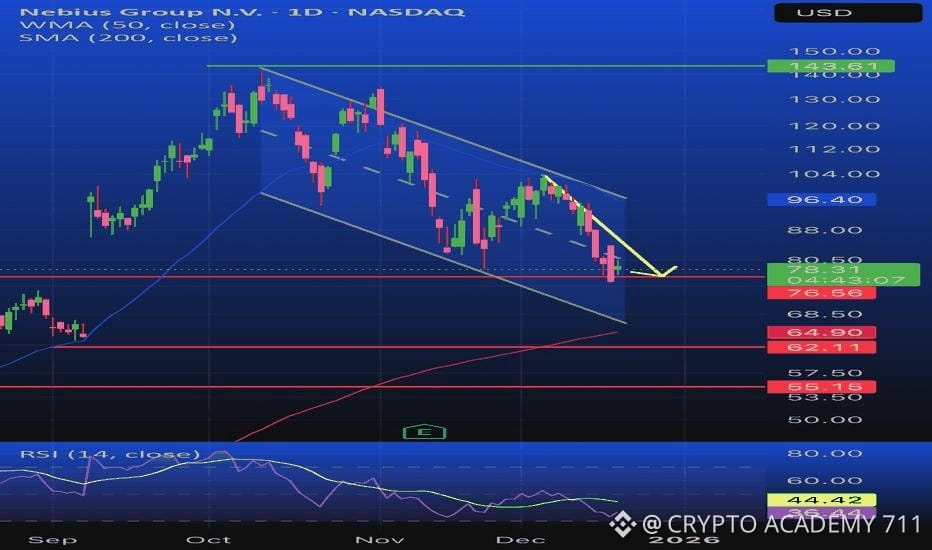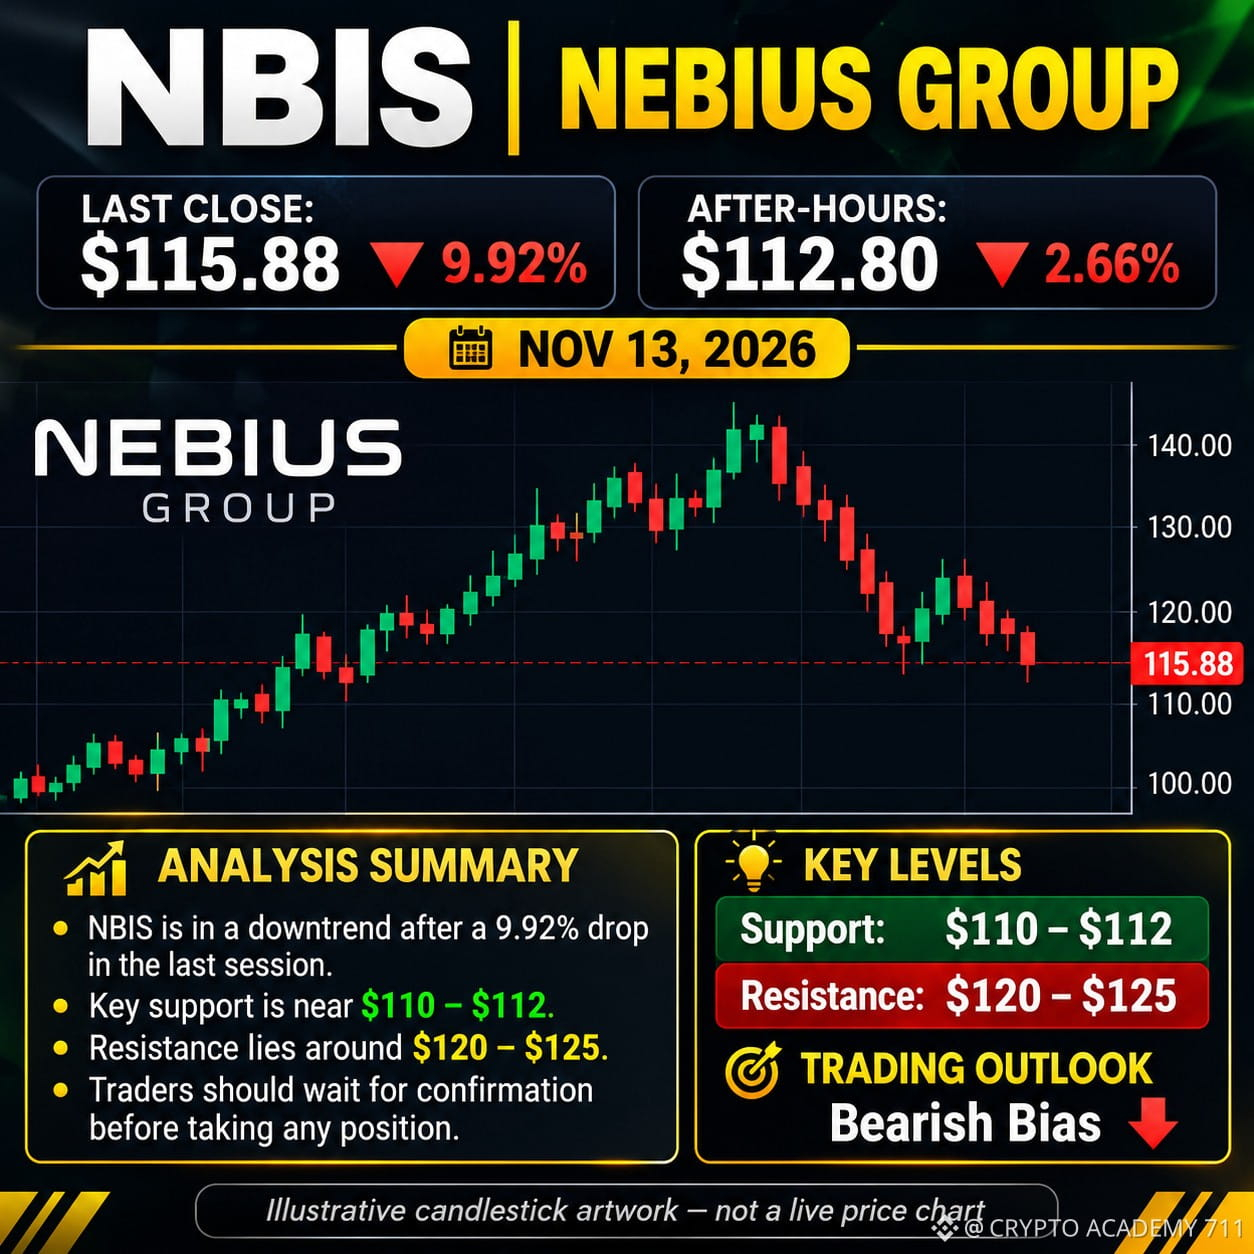
$NBIS NBIS (Nebius Group) – Latest Market Analysis
NBIS is facing significant selling pressure following its latest earnings report.
💰 Last Closing Price: $115.88
📉 Daily Change: -9.92%
🔹 Resistance Levels
R1: $116.28
R2: $123.57
R3: $131.25
🔹 Support Levels
S1: $108.60
S2: $101.31
S3: $93.63
📈 Bullish Scenario: A strong recovery above $116.28 could open the door toward $123.57.
📉 Bearish Scenario: Losing $108.60 could increase downside pressure toward $101.31.
🎯 My Outlook: Short-term bearish until NBIS reclaims key resistance levels. Watch volume and price action before entering any trade.
⚠️ Trade carefully. This is market analysis, not financial advice.
#NBIS #Nebius #StockMarket #NASDAQ #TradingAnalysis #TechnicalAnalysis
NBIS is facing significant selling pressure following its latest earnings report.
💰 Last Closing Price: $115.88
📉 Daily Change: -9.92%
🔹 Resistance Levels
R1: $116.28
R2: $123.57
R3: $131.25
🔹 Support Levels
S1: $108.60
S2: $101.31
S3: $93.63
📈 Bullish Scenario: A strong recovery above $116.28 could open the door toward $123.57.
📉 Bearish Scenario: Losing $108.60 could increase downside pressure toward $101.31.
🎯 My Outlook: Short-term bearish until NBIS reclaims key resistance levels. Watch volume and price action before entering any trade.
⚠️ Trade carefully. This is market analysis, not financial advice.
#NBIS #Nebius #StockMarket #NASDAQ #TradingAnalysis #TechnicalAnalysis