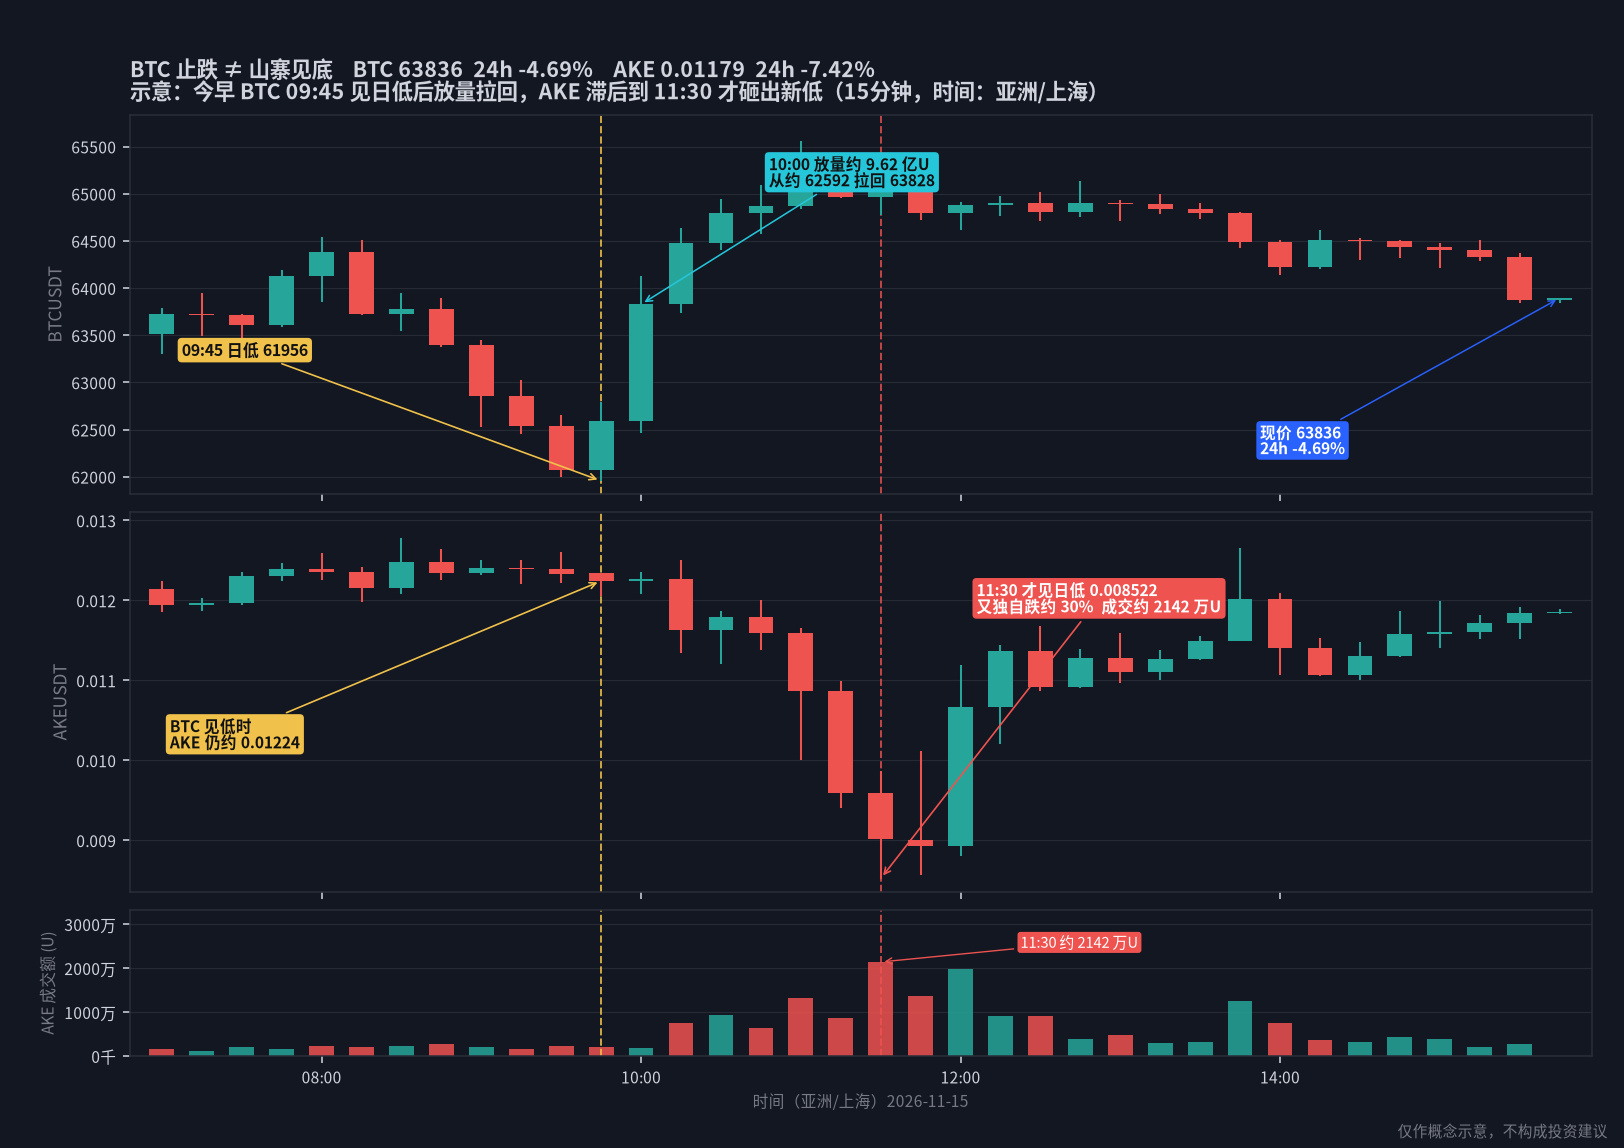
This morning, $BTC hit the day’s low of 61956 at 09:45. Then, at 10:00, a 15-minute candle saw volume surge to about 962 million U, pulling the price back from around 62592 to 63828. Many people might instinctively think: the major coin has stopped falling, so it’s safe to buy the dip on altcoins following its lead too.
But $AKE hadn’t bottomed out at the same time. Around 09:45, it was still at about 0.01224, barely following the drop. Its real plunge came after $BTC had already recovered: selling volume picked up from 10:15, and at 11:00 a single candle saw about 13.27 million U in trading volume, sending it down to 0.010001. At 11:30, volume surged again to about 21.42 million U, driving it to a daily low of 0.008522. From the point when “$BTC had already stopped falling” to when $AKE actually bottomed, it fell another roughly 30% on its own. The current price is about 0.01179, down around 7.4% over 24 hours; by comparison, $BTC is currently around 63836, down about 4.7% over 24 hours.
The right approach is to first check whether the coin’s own candlestick chart has stopped making new lows, then decide whether to follow. Correlation doesn’t mean moving in sync; delays and further drops are common. Don’t treat a rebound in a major coin as a buy signal for coins following its lead.
When looking for a rebound, do you first check the altcoin’s own low, or first see whether $BTC has turned back up?
For informational purposes only; this is not investment advice.
#合约 #CandlestickChart
But $AKE hadn’t bottomed out at the same time. Around 09:45, it was still at about 0.01224, barely following the drop. Its real plunge came after $BTC had already recovered: selling volume picked up from 10:15, and at 11:00 a single candle saw about 13.27 million U in trading volume, sending it down to 0.010001. At 11:30, volume surged again to about 21.42 million U, driving it to a daily low of 0.008522. From the point when “$BTC had already stopped falling” to when $AKE actually bottomed, it fell another roughly 30% on its own. The current price is about 0.01179, down around 7.4% over 24 hours; by comparison, $BTC is currently around 63836, down about 4.7% over 24 hours.
The right approach is to first check whether the coin’s own candlestick chart has stopped making new lows, then decide whether to follow. Correlation doesn’t mean moving in sync; delays and further drops are common. Don’t treat a rebound in a major coin as a buy signal for coins following its lead.
When looking for a rebound, do you first check the altcoin’s own low, or first see whether $BTC has turned back up?
For informational purposes only; this is not investment advice.
#合约 #CandlestickChart